


- Magnetic Shielding Properties of Bio-Based Epoxy Paints Filled with Iron Oxide Nanoparticles
Faruk Turan
 , Gökhan Çayli*,† , Serap Çeklİ** , Demet Sezgin Mansuroglu***, and Cengiz Polat Uzunoğlu**
 Adıyaman University, Vocational School of Gölbaşi, Department of Property Protection And Security, Adıyaman 02040, Turkey
*Istanbul University-Cerrahpasa, Department of Engineering Sciences, Engineering Faculty,
Avcilar Campus, Istanbul, 34320, Turkey
**Istanbul University-Cerrahpasa, Department of Electrical Engineering, Engineering Faculty,
Avcilar Campus, Istanbul, 34320, Turkey
***Bogazıcı University, Center for Life Sciences and Technologies LifeSci, Kandilli Campus, Istanbul, 34684, Turkey- 산화철 나노입자를 포함한 바이오 기반 에폭시 페인트의 자기 차폐 특성
Reproduction, stored in a retrieval system, or transmitted in any form of any part of this publication is permitted only by written permission from the Polymer Society of Korea.
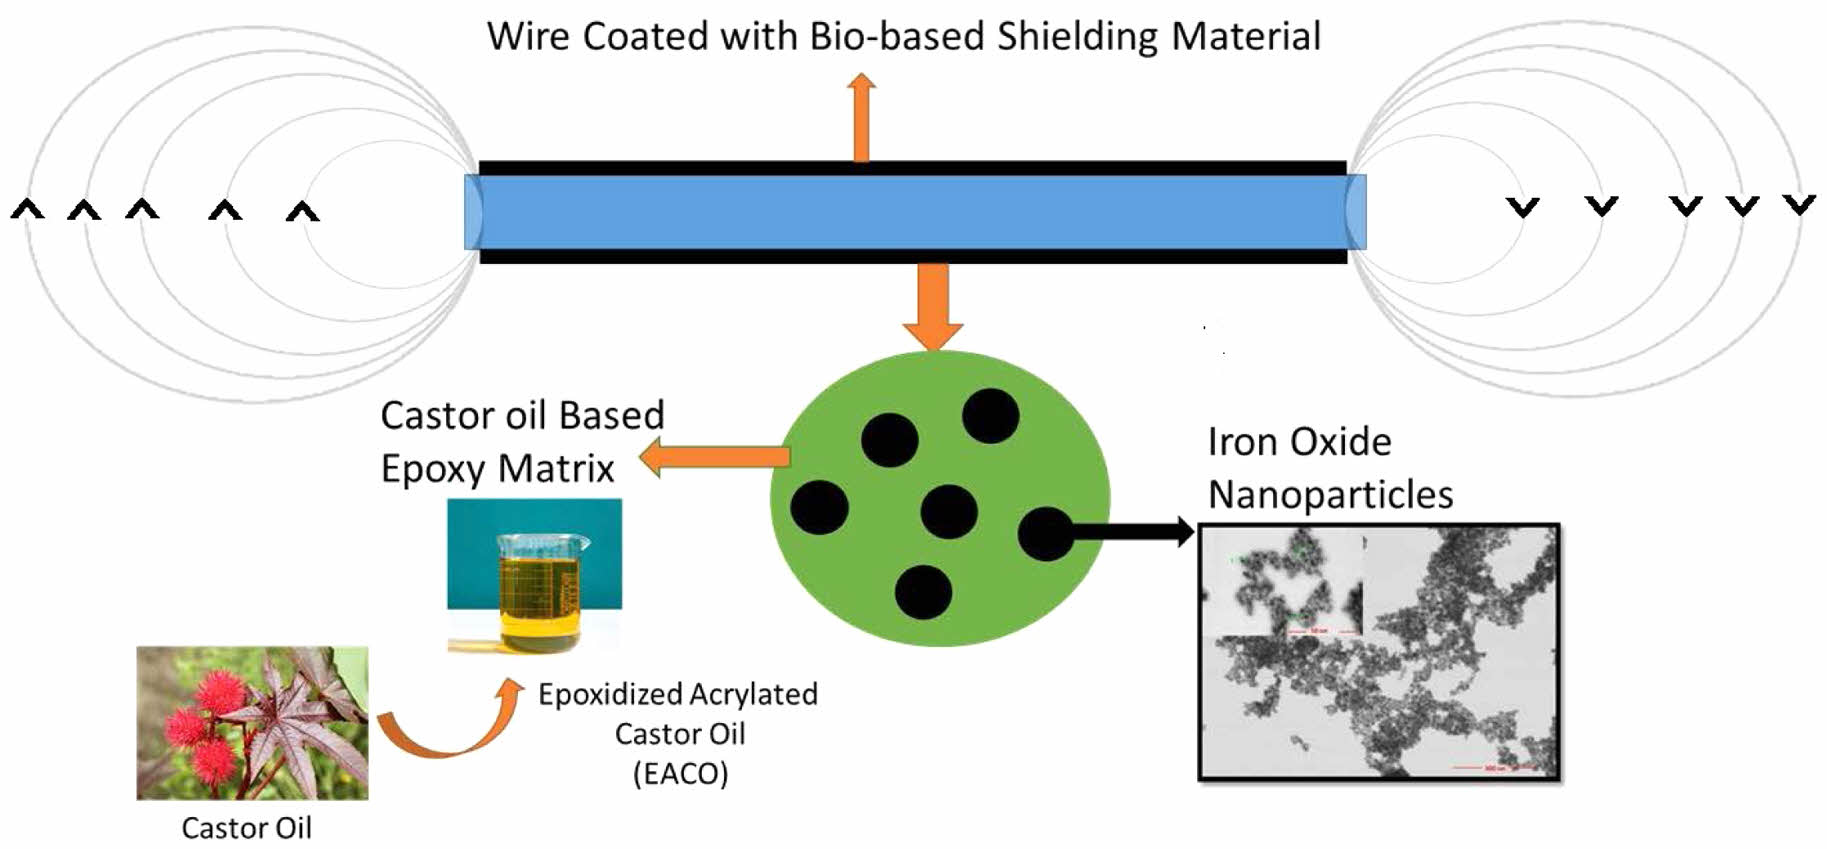
In this study, magnetic shielding and thermal properties of iron oxide nanoparticle filled bio-based epoxy paint are studied. The synthesis of the epoxidized acrylated castor oil (EACO), which is the main component of bio-based epoxy paint, consists of two steps. Acrylation of the castor oil occurs in the first step and epoxidation is then followed. The product is EACO. FTIR and 1H NMR techniques are used to characterize of the starting materials and monomer. In the paint formulations, 90% EACO monomer is mixed with 10% acrylic acid (AA). Oleic acid coated iron oxide nanoparticles, then, are added to the paint resin up to 80%. Photopolymerization of the synthesized materials is studied with one-by-one mixture of DMPA and AIBN catalysts. Thermal properties of the synthesized polymers are also evaluated. TGA and DSC techniques are used. Neat bio-based epoxy paint shows two Tg at -4 and 60 ℃ respectively. The 5% weight loss temperature is observed on cured bio-based resin at 205 ℃. Additionally, 50% weight loss temperature is measured at 425 ℃. The cured paints are tested for electrical switchgear in terms of magnetic shielding. It is found that the synthesized materials would reduce the magnetic field (B) of an electrical cord up to 80%. Additionally, magnetic shielding of control transformer by using synthesized paint formulations provide significant shielding up to 11%.
Epoxy resins are among the most extensively utilized casting materials, primarily due to their excellent mechanical, thermal, and chemical properties. In the present study, a novel application of a bio-based epoxy resin system is reported. The incorporation of iron oxide nanoparticles into the bio-based epoxy matrix led to a substantial enhancement in electromagnetic interference (EMI) shielding performance. This improvement is ascribed to the high magnetic saturation of the iron oxide nanoparticles and their uniform dispersion throughout the polymeric matrix. The resulting nanocomposite coatings exhibited superior shielding effectiveness, highlighting their potential for use in advanced electronic devices, electromagnetic protection systems, and energy-related applications.
Keywords: castor oil, epoxy acrylates, renewable resources, iron oxide, magnetic shielding, electrical networks.
The authors declare that there is no conflict of interest.
The unusual features and prospective applications of magnetic nanocomposites have attracted considerable attention in recent years. The magnetic and electromagnetic shielding properties of ferrite-based nanoparticles, including Ni, Co, and Mn ferrites, have been widely investigated.1-2 These materials exhibit exceptional magnetic characteristics, chemical stability, and biocompatibility, rendering them appropriate for a diverse array of applications, such as medical, industrial, and magnetic engineering.
Cobalt ferrite (CoFe2O4) is a type of ferrite nanoparticle that stands out because of its remarkable magnetic characteristics, including strong coercivity, magnetic anisotropy, and saturation magnetization.3 Graphene-based materials have attracted considerable attention because of their distinctive structural, electrical, and thermal capabilities, in addition to ferrite nanoparticles. The integration of ferrite nanoparticles and graphene-based materials has led to the creation of innovative nanocomposites that exhibit improved electromagnetic shielding and wastewater treatment capabilities.1 In addition to the aforementioned nanomaterials, iron oxide nanoparticles have attracted growing interest because of their distinctive magnetic characteristics, chemical stability, and biocompatibility.4,5 Extensive research has been conducted on iron oxide nanoparticles for diverse purposes, such as magnetic resonance imaging, medication administration, and cancer therapy.3
Another intriguing characteristic of iron oxide nanoparticles is their ability to provide magnetic shielding for electromagnetic radiation in electrical grids. By employing magnetic shielding materials, it is feasible to reduce the intensity of electromagnetic radiation sent by electrical grids. The global electrical grid is constantly expanding due to increased electricity demand. As the electrical infrastructure expands, the increased power demand necessitates the use of more current. This, in turn, creates excessive non-ionizing electromagnetic fields (EMF) in the surrounding environment. Power system-based low frequency electromagnetic interferences (EMI) are commonly noticed in daily life,6,7 in addition to high frequency EMF sources.8,9 Although it is generally believed that high voltage (HV) transmission lines are the primary sources of EMF that cause disturbances in the electrical grid, it is important to note that even the electrical cord of a home device can produce hazardous EMF.10-12 There are ferromagnetic cores in transformers, which are prone to accelerating magnetic fluxes and, as a result, electromagnetic interference.13,14 A number of recent studies have demonstrated that EMF have a direct connection to health problems, and that exposure to higher levels of EMF can lead to severe disorders. On the basis of these research, exposure to EMF has the potential to cause a variety of diseases, including but not limited to childhood leukemia, malignancies, Parkinson's disease, neurological diseases, and others. As a result of the health concerns, the European authorities have issued a notification requesting that precautions be taken against EMF exposure in everyday life. The extensive presence of electrical networks in residential and industrial regions is the primary motivation behind electromagnetic field exposure research.15 In order to lessen the impacts of EMF, a number of different shielding strategies have been presented in the research literature for power system appliances.16-18
Not only have many kinds of electromagnetic compounds been introduced in recent times, but they have also been used for shielding purposes.19,20 Among the materials used for shielding, iron oxide-based ones are receiving an increasing attention. Many studies can be found in the literature about the shielding properties of iron oxide particles.21-24
The majority of magnetic shielding compounds possess a particulate form, making it challenging to get a flexible, unified material from the initial compounds. Therefore, including magnetic shielding chemicals in composites appears to be a viable alternative for achieving flexible materials with magnetic shielding properties. Composite materials filled with iron oxide nanoparticles and graphene, seem to be promising materials for several applications. Polymeric materials such as polyolefins, polyurethanes, acrylics, and epoxy resins can be employed as a polymer matrix.25-27
Epoxy resins are one of the most valuable materials for polymer matrices because of their ease of accessibility, application and performance characteristics. Epoxy resins are mainly derived from fossil resources. When the environmental concerns and sustainable development are taken into consideration, bio derived epoxy resins would appear an interesting alternative to traditional petroleum-based epoxy resins.
Among bio-derived epoxy resins, those synthesized from plant oil triglycerides are particularly promising due to their wide availability, renewability, and compatibility with existing polymer networks.28 Plant oil triglycerides have numerous reactive positions. These include ester groups, double bonds, allylic positions, and α carbon to the carbonyl groups. It is possible to add polymerizable groups into the triglycerides through the use of those reactive portions. Reactive functional groups such as halides, hydroxyls, thiols, epoxies, and amines can be inserted into a triglyceride by using chemical or enzymatic procedures.29,30 Modification via ester groups and double bonds proceeds throughout simple chemical reactions and thus, the reaction products are employed in industry. Epoxidized soybean oil (ESO) and its derivatives, for example, are readily available in large quantities as a bio-based epoxy resins which are suitable for many paint applications. As a non-edible triglyceride, castor oil is a valuable resource as a precursor for bio-based epoxy resins. Brazil and India are the two main producers of castor oil. Ricinoleic acid counts for ninety percent of castor oil. Ricinoleic acid is an 18-carbon containing unsaturated fatty acid with a hydroxyl group at the 12th carbon. Numerous papers and patents have been published in the literature that is concerning about the modification of the double bonds and hydroxyl groups of castor oils.31-36
The current work focuses on the synthesis and characterization of magnetic shielding properties of bio-based epoxy paints that are loaded with iron oxide nanoparticles. In order to accomplish this goal, the mixture of epoxidized acrylated castor oil (EACO) and acrylic acid (AA) is utilized as the polymer matrix, and nano iron oxide was utilized as the magnetic shielding material. This study utilized a paint composed of iron oxide (magnetite) to perform a range of experiments on magnetic shielding at the frequency of power systems (50Hz). The majority of low voltage electrical grids consist of single-phase electrical wires and a variety of transformers. Magnetic shielding experiments were performed on a 2 kVA, 110V/220V dry type control transformer with a ferromagnetic core, as well as on a H05VV-F (HAR), 250 V single phase, and copper conductor cable with polyvinyl chloride (PVC) insulation. During the testing, shielding paint is manufactured using varying quantities of iron oxide material, and the corresponding shielding effects are evaluated. The Extech Multi-Field EMF meter (EMF 450) is used to record electromagnetic field readings.
The structures of the synthesized bio-based epoxy resins are shown in Figures 1 and 2.
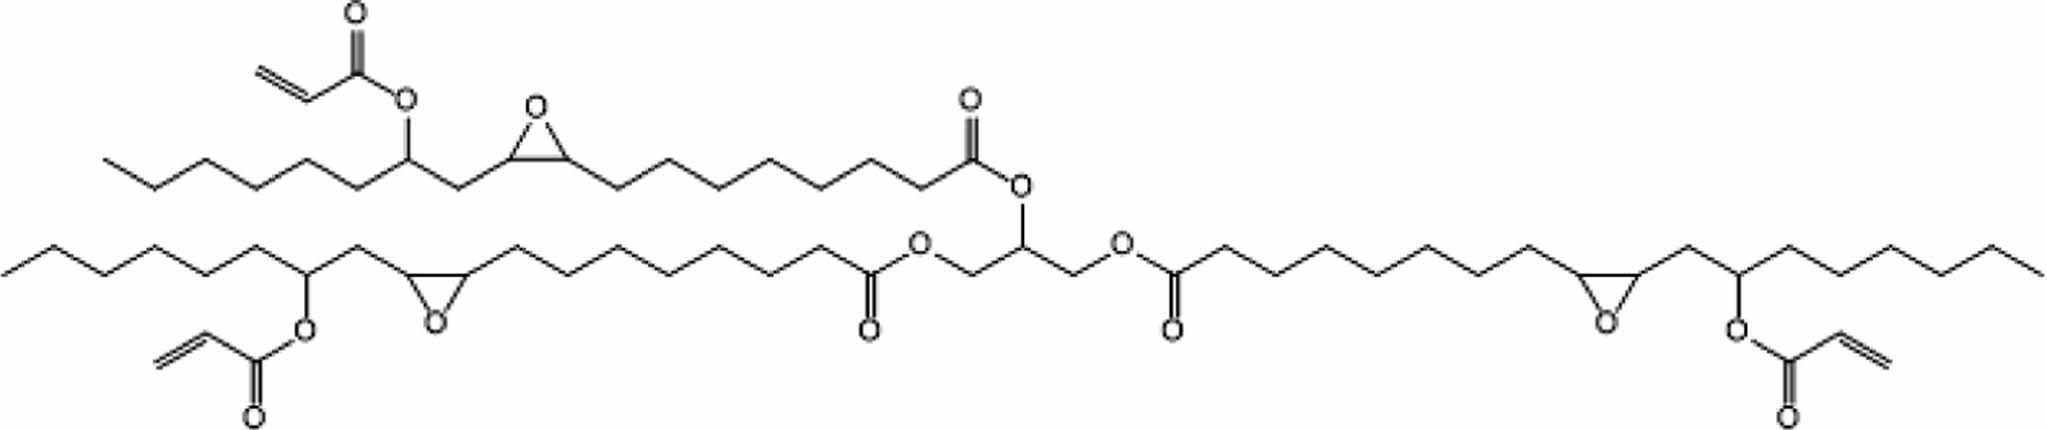
|
Figure 1 Structure of epoxidized acrylated castor oil (EACO). |
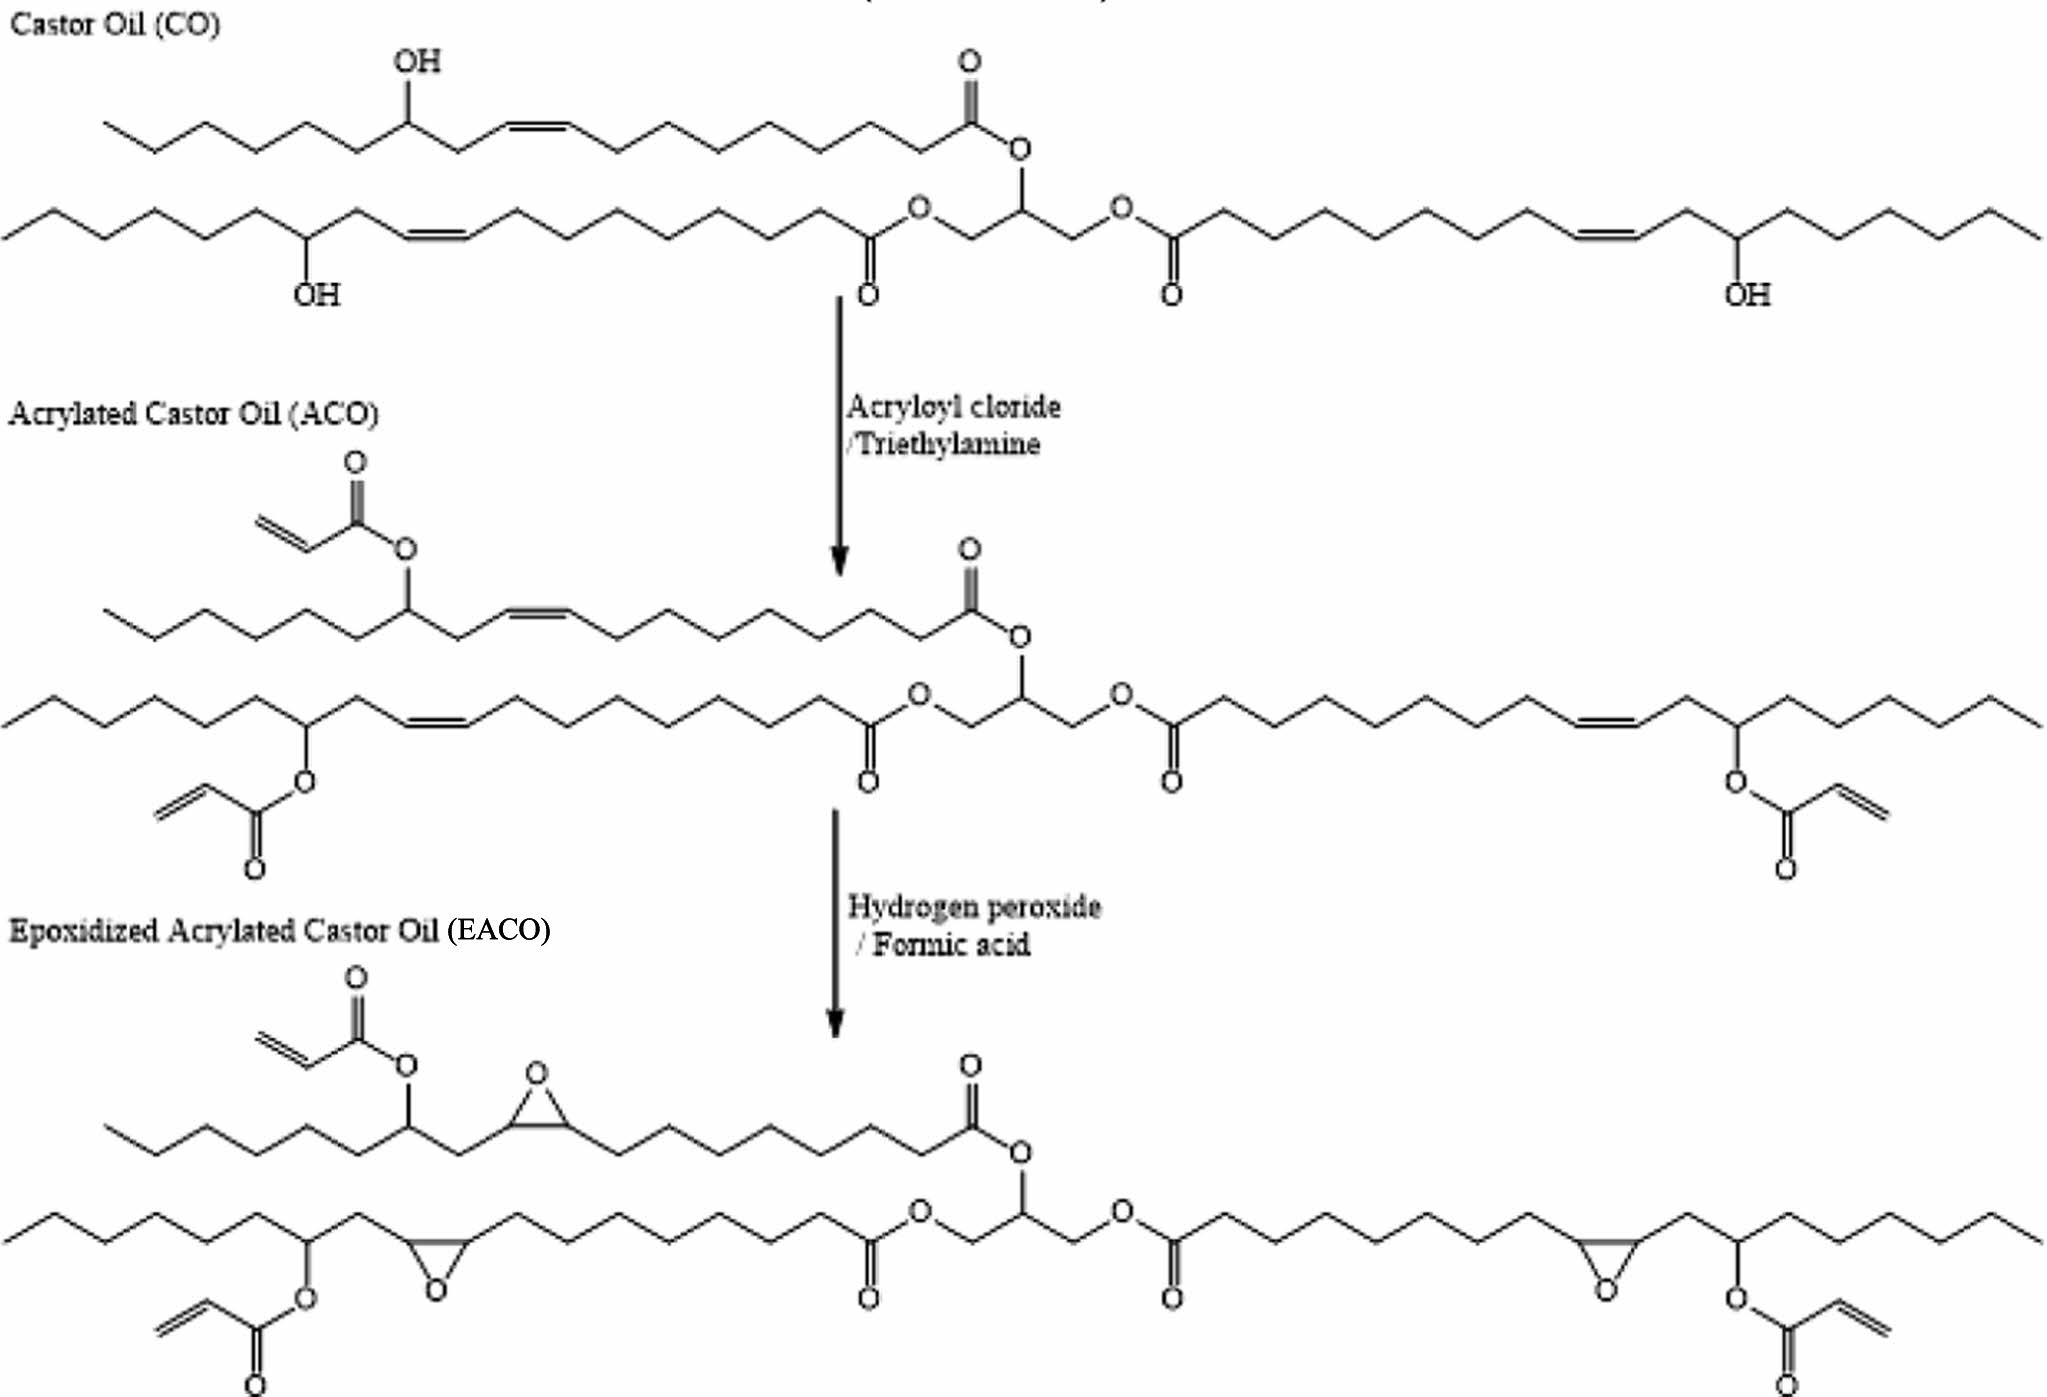
|
Figure 2 Synthesis of epoxidized acrylated castor oil. |
Materials and Methods. Acryloyl chloride, acrylic acid, azobisisobutyronitrile (AIBN), castor oil, dichloromethane, formic acid, ethyl acetate, 2,2-dimethoxy-2-phenylacetophenone (DMPA), hydrogen peroxide, methanol, phosphoric acid, sodium chloride, sodium hydroxide, sodium sulfate, tetrahydrofuran, and triethylamine were supplied from Merck (Darmstadt, Germany) and they were used without any further purification. IR characterization of compounds and polymers was performed by Nicolet 380 FTIR spectrometer with Smart Diamond ATR. The 1H and 13C NMR spectra were recorded on a Varian 400-MHz NMR instrument operating at a frequency of 399.986 MHz for proton. 220 V, 15 W, 365 nm UV lamp was used as radiation source. Magnetic shielding experiments were performed on a 2 kVA, 110 V/220 V dry type control transformer with a ferromagnetic core, as well as on a H05VV-F (HAR), 250 V single phase, and copper conductor cable with polyvinyl chloride (PVC) insulation. The Extech Multi-Field EMF meter (EMF 450) is used to record electromagnetic field readings. High-resolution surface characterization of IONP and oleic acid coated IONP was performed by using FE-SEM/STEM under high vacuum. Each nanoparticle was suspended in water at a ratio of 1 : 10 and dropped onto a carbon film-coated cupper grid (TED PELLA, Pure carbon film 300M Cu). Images were taken at 300 nm-50 nm scales using 30 kV and 1 spot size.
Synthesis of Acrylated Castor Oil (ACO). Acrylated castor oil was synthesized according to literature.37,38 20 g of castor oil (equivalent to 0.0108 moles) were dissolved in 50 milliliters of dry THF in a 250 mL round bottom flask. Subsequently, 3.54 g of TEA were added to the mixture. The solution is chilled in an ice bath to a temperature of 5 ℃, and then a solution containing 3.17 g of acryloyl chloride is added slowly and gradually over a period of 30 minutes. Temperature must not surpass 5 ℃ during the process of adding. The mixture was agitated for a duration of 2 h. Following completion of the reaction, the THF solvent was removed using evaporation. The resulting impure product was then dissolved in 100 mL of dichloromethane and subjected to several washes with 50 mL of a 0.1 N HCl solution, followed by 50 mL of a saturated salt solution. Upon drying with anhydrous sodium sulfate, the dichloromethane was evaporated, resulting in the production of acrylated castor oil (ACO).
Synthesis of Epoxidized Acrylated Castor Oil (EACO). Epoxidized acrylated castor oil was synthesized according to literature.37,38 A solution was prepared by combining 10 g of acrylated castor oil (equivalent to 0.0092 mol) with 4.00 g of formic acid in a 250 mL flask. Subsequently, the mixture was cooled to a temperature of 0 ℃. While agitating this mixture, 5.66 g of a 50% hydrogen peroxide (H2O2) solution was added at a temperature ranging from 0 to 5 ℃. The combination was allowed to stand at a temperature of 0 ℃ for a duration of 1 h. Subsequently, the mixture was stirred for 16 h at ambient temperature. Upon finishing the reaction, the final product was dissolved in 50 mL of dichloromethane and transferred to a separatory funnel. It was then subjected to a series of washes using different solutions. Initially, the product underwent a washing process using approximately 50 mL of distilled water. Subsequently, the product was rinsed with a 50 mL solution of sodium bicarbonate, with a concentration of 5%. Next, the organic layer was rinsed with 50 mL of a concentrated sodium chloride solution. The layer of dichloromethane was dehydrated using anhydrous sodium sulfate. The sodium sulfate was separated by filtration and the dichloromethane was removed by evaporation.
Synthesis of Oleic Acid. In a 250 mL of beaker, 100 g of olive oil is weighted and heated to 100 ℃. Then, 40 g of 50% NaOH solution is added to this hot olive oil in portions. This viscous paste then is mixed at 80 ℃ with constant stirring rate at 800 rpm. After 2 h, the paste is cooled and 100 mL of distilled water is added and mixed. To this slurry, 18.5 g of concentrated HCl solution is added dropwise. After completion of HCl addition, the oleic acid residue is separated as oil above the water layer. All mixture is extracted with 100 mL diethyl ether and dried over sodium sulphate. The ether is evaporated by the rotary evaporator.
Synthesis of Iron Oxide Nanoparticles (IONP). In a separate 250 mL beakers, 5.4 g of iron (III) chloride hexahydrate and 5.6 g of iron (II) sulphate pentahydrate are dissolved in 100 mL distilled water. After 15-minute stirring, the solutions were mixed. After 30 minutes mixing, concentrated ammonia solution is added to this mixture dropwise. After smelling of ammonia, addition of ammonia is completed. The color of the mixture was turned to black.
Modification of IONP’s with Oleic Acid
. In order to modify the iron oxide nanoparticles, 100 mL of iron oxide nanoparticle solution is mixed with 2.5 g of oleic acid. This mixture was stirred at room temperature and then was mixed at 60 ℃ for 1 h. After 1 h, water was removed by vacuum.
Photopolymerization of Iron Oxide Nanoparticles Containing Bio-based Epoxy Paints. Bio-based epoxy paint mixtures consisting of 10% acrylic acid and 90% EACO containing up to 70% oleic acid-coated iron oxide nanoparticles were employed for the photopolymerization reactions. One by one DMPA and AIBN mixture were used as photoinitiators. The amount of initiator was selected as 0.5%, 1% and 3% based on the weight of the bio-based epoxy paint mixture. The initiators were dissolved in a small amount of ethyl acetate, and this uniform mixture was combined with 1 g of reactive epoxy resin mixture. The polymerization process was carried out by exposing the solution to UV radiation at a wavelength of 365 nm, a 230 V electrical power supply and a frequency of 50/60 Hz, with a power output of 15 W. Polymerization continued until synthesized bio-based epoxy formulations transformed into a solid. Then the cured solid was post cured in an oven for 24 h at 50 ℃.
The polymer gel was submerged in diethyl ether for an hour in order to remove any unreacted monomers that might have remained inside the solid and to calculate the conversion during kinetic tests. The monomer conversion was determined using a gravimetric method.
EMF on Electrical Cord. The low voltage and medium voltage distribution sections of the grid are connected through electrical wires, which generate EMF that can be disruptive depending on the strength of the current. The magnetic field surrounding a wire can be determined using the formula.
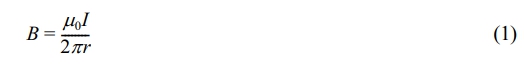
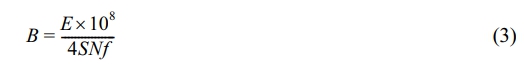
The variables in the equation are as follows: B represents the magnetic field density in tesla (T), I represent the current in amperes (A) flowing through a wire or cable, µ0 represents the permeability of empty space which is equal to 4π×10-7 Tm/A, and r is the distance of the fluxes from the wire. There are various studies on EMI shielding of power cables for health issues.39-40 In this study, it is aimed to focus on electrical cords for indoor use. The experiments utilize a H05VV-F (HAR) cable with a copper conductor and PVC insulation, operating at a single phase at 250 V. The magnetic shielding paint contains iron oxides with concentrations of 30%, 50%, and 70%, respectively. The EMFs are assessed on both unshielded and shielded cable segments based on the distance (r) of the fluxes generated around the cable. Figure 3 displays the block diagram of the test setup.
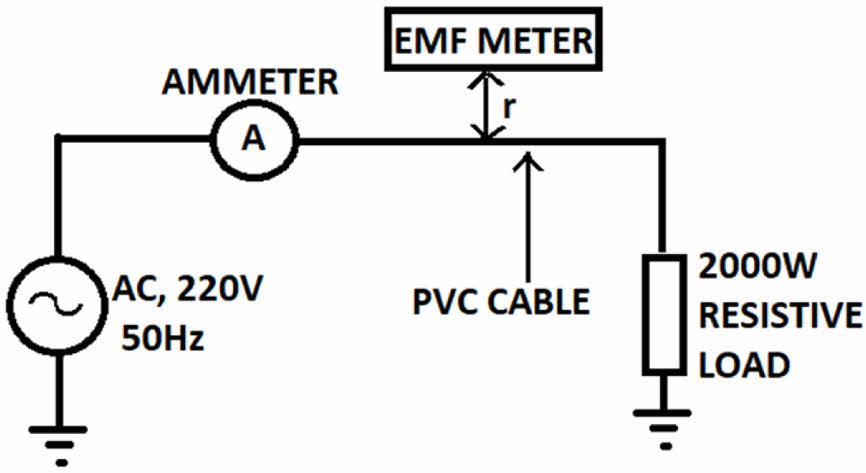
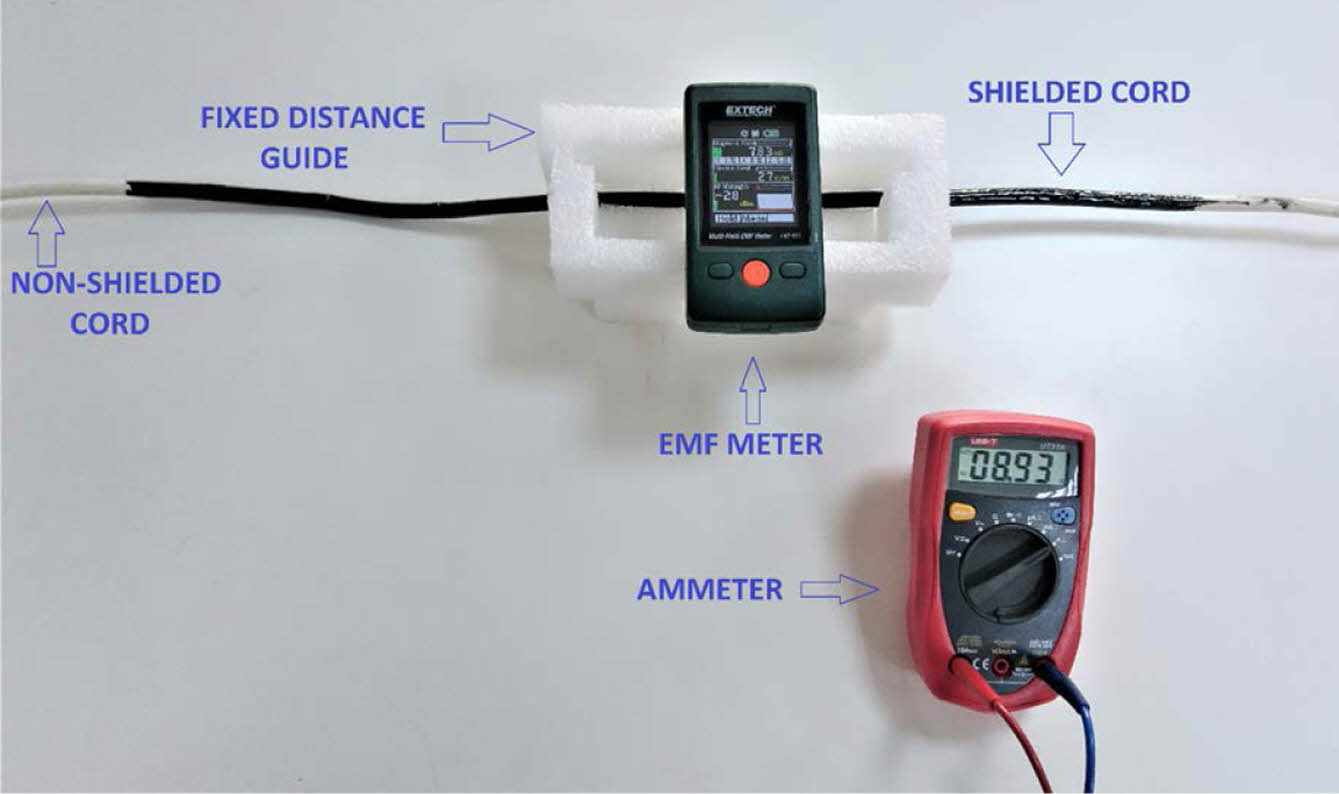
To mitigate the presence of excess EMF from the load, a 2000 W pure resistive load (specifically a heater) is selected. As previously stated, the magnetic field is directly influenced by the magnitude of the electric current. An ammeter is used to measure the current of the load. The EMF 450 is designed to monitor both magnetic and electrical fields, making it suitable for electromagnetic field measurements. The units of measurement for Gauss and Electrical field are G and V/m, respectively. In order to emphasize the impact of distance, experiments are conducted at various distances from the wire using a set distance guide. Figure 4 displays the experimental arrangement used for measuring electrical cord properties.
EMF on Control Transformer. Transformers are essential components of electrical networks. These objects have ferromagnetic cores that can increase magnetic fluxes through their functioning concept. Although studies are concerned with power transformer shielding techniques, all transformers prone to produce unwanted electromagnetic field effects aside from power ratings.41,42 The main voltage of the transformer is determined by the relationship between the secondary voltage, the windings, and the flux (Φ) of the core.
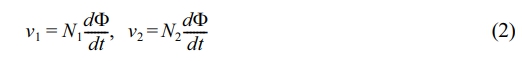
N1 and N2 represent the quantities of windings in the electrical circuit. The instantaneous flux Φ is identical for both windings. The magnetic field density of a typical transformer can be calculated as
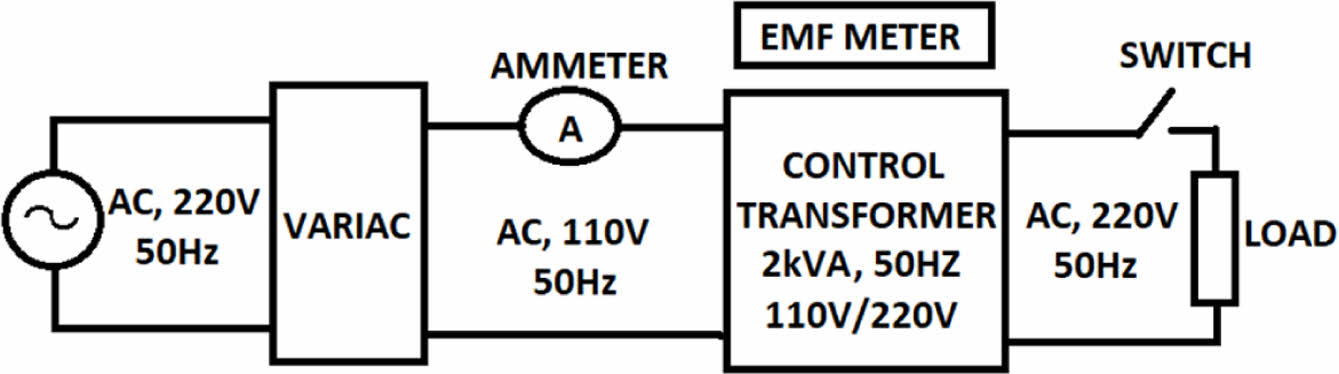
The symbol E represents the electric potential difference, denoted in volts (V). The symbol S represents the size of the cross-section, N represents the number of turns in the windings, and f represents the frequency, measured in hertz (Hz). This study used a 2 kVA, 110V/220V, 50 Hz control transformer to monitor EMF. A 7.5 kVA variac (autotransformer) with adjustable output ranging from 0 to 220 V is used to provide primary transformers. Figure 5 depicts the schematic diagram of the experimental configuration.
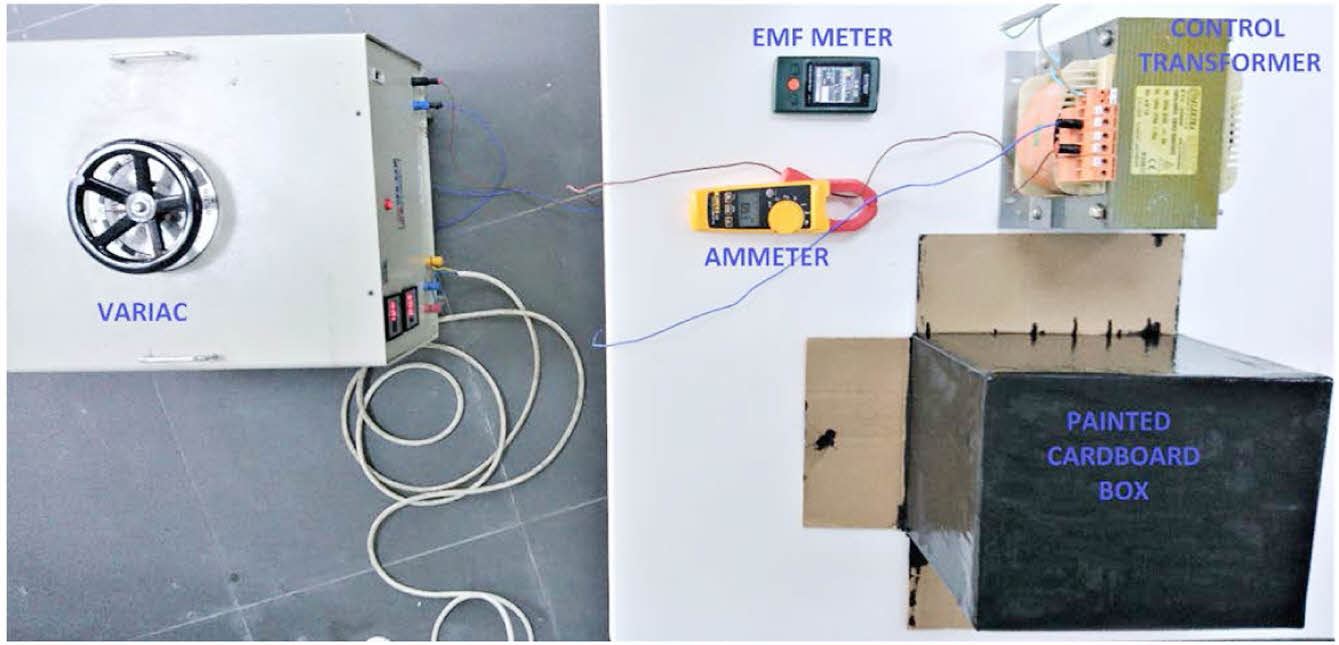
During the testing process, a clamp ammeter is utilized to accurately measure the primary current of the control transformer. The control transformer undergoes testing under both no-load and full-load (1 kW resistive) situations. Conventional cardboard boxes are used to encase the central part of the transformer, which is appropriate for the intended magnetic coating. The EMF meter is situated on both the painted and non-painted boxes that encase the control transformer. Figure 6 illustrates the experimental configuration of the control transformer.
|
Figure 3 Block diagram of electrical cord test setup. |
|
Figure 4 Experimental setup of electrical cord. |
|
Figure 5 Block diagram of transformer test setup. |
|
Figure 6 Experimental setup of control transformer. |
Synthesis and Characterization of Monomer. The structure of EACO is depicted in Figure 1, while the synthesis of EACO is illustrated in Figure 2. The synthesis of EACO involved two distinct processes, as depicted in the figure. The acrylation of castor oil occurred in the initial stage. In the acrylation reaction, acryloyl chloride was combined with castor oil in ratios of 3 : 1. The acrylation reaction was fully accomplished within a duration of 2.5 h. The reaction was initiated at a temperature of 0 ℃ for the initial 30 minutes, after which it was increased to the ambient temperature for a duration of 2 h. Epoxidation reaction was the second step. The acrylated double bond did not undergo epoxidation due to its resonance structure, but the olefinic double bond of ricinoleic acid moiety of castor oil underwent epoxidation. The epoxidation reaction was conducted at ambient temperature and achieved full completion during a duration of 16 h. Despite the need for extended reaction times, all reactions were successfully conducted at ambient temperature.
The produced materials exhibit the properties of transparency and low viscosity, appearing as liquid substances. The viscosity of EACO was determined to be 3500 centipoises (cP). This relatively low viscosity makes this monomer a good candidate for numerous industrial processes. Moreover, addition of acrylic acid made positive impact to lower the viscosity of EACO. Addition of 10% of acrylic acid could reduce the viscosity of EACO mixture to 3100 cP.
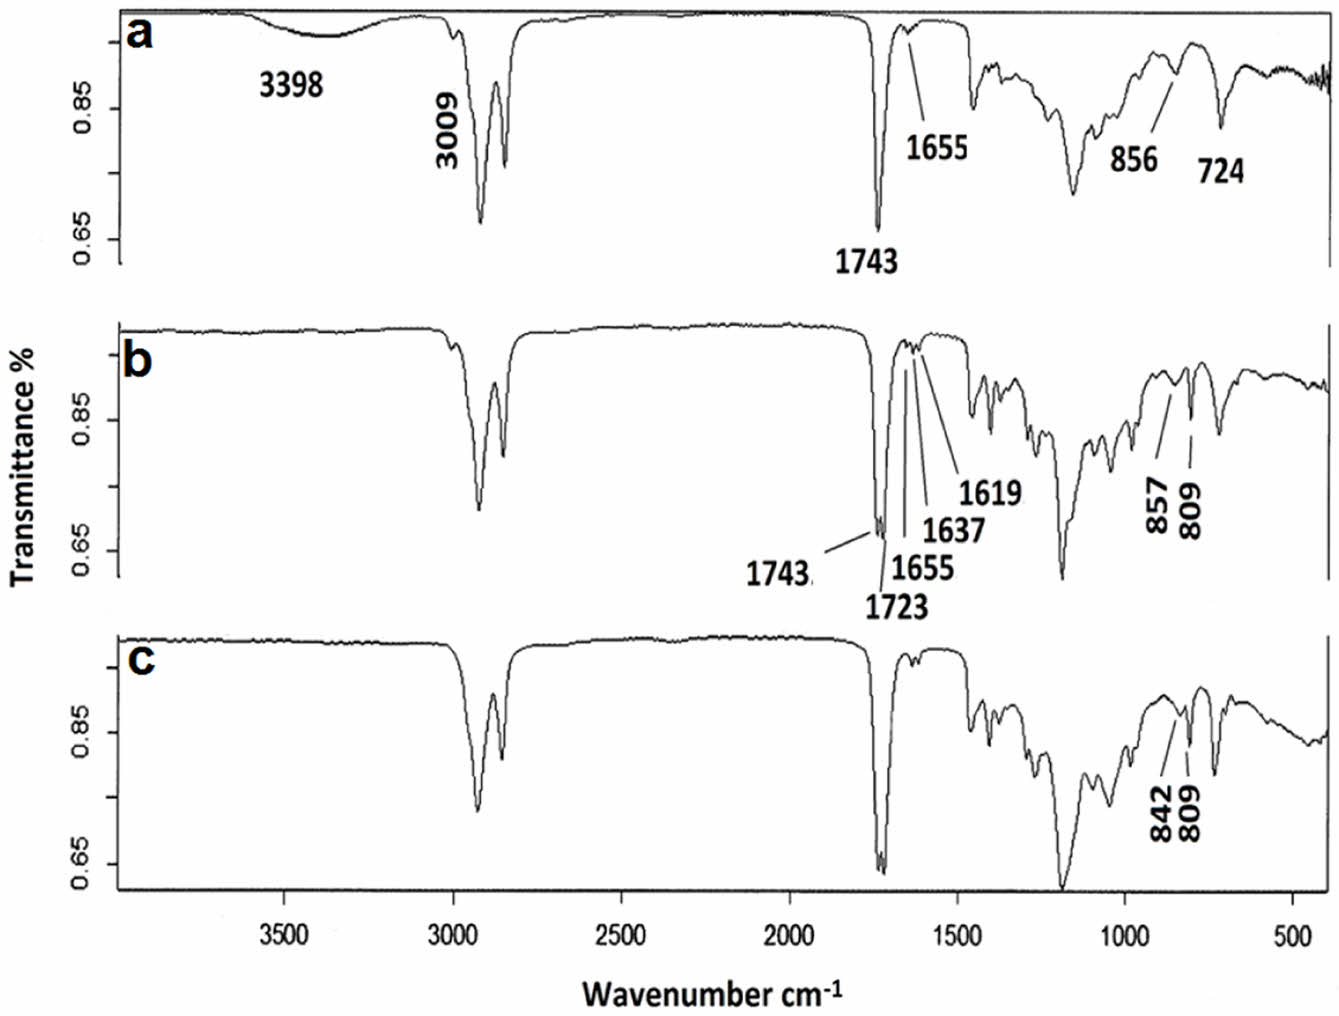
FTIR and 1H NMR techniques were used to characterize EACO monomer, which is the main component of paint formulation. The FTIR spectra of the synthesized materials are displayed in Figure 7. The monitoring of the modification of castor oil was simply conducted using an FTIR instrument. The spectrum displayed distinct peaks at 3500 cm-1, corresponding to the stretching of -OH groups, at 1743 cm-1 as a prominent peak indicating the presence of ester groups, and at 3009, 1637, and 724 cm-1 as weaker peaks, indicating the presence of C=C double bonds. The presence of a prominent peak at 724 cm-1 also suggested that the C=C double bond had a cis configuration. The introduction of the acrylate moiety resulted in the disappearance of the peak at 3500 cm-1 due to the consumption of the -OH groups. A supplementary signal seen at 1722 cm-1 suggested the existence of acrylate esters. Upon acrylation, distinct peaks at 1637 and 1619 cm-1 were determined, also indicating the presence of acrylate double bonds. Upon completion of the epoxidation process, the presence of oxirane groups can be detected by a tiny peak at 842 cm-1.
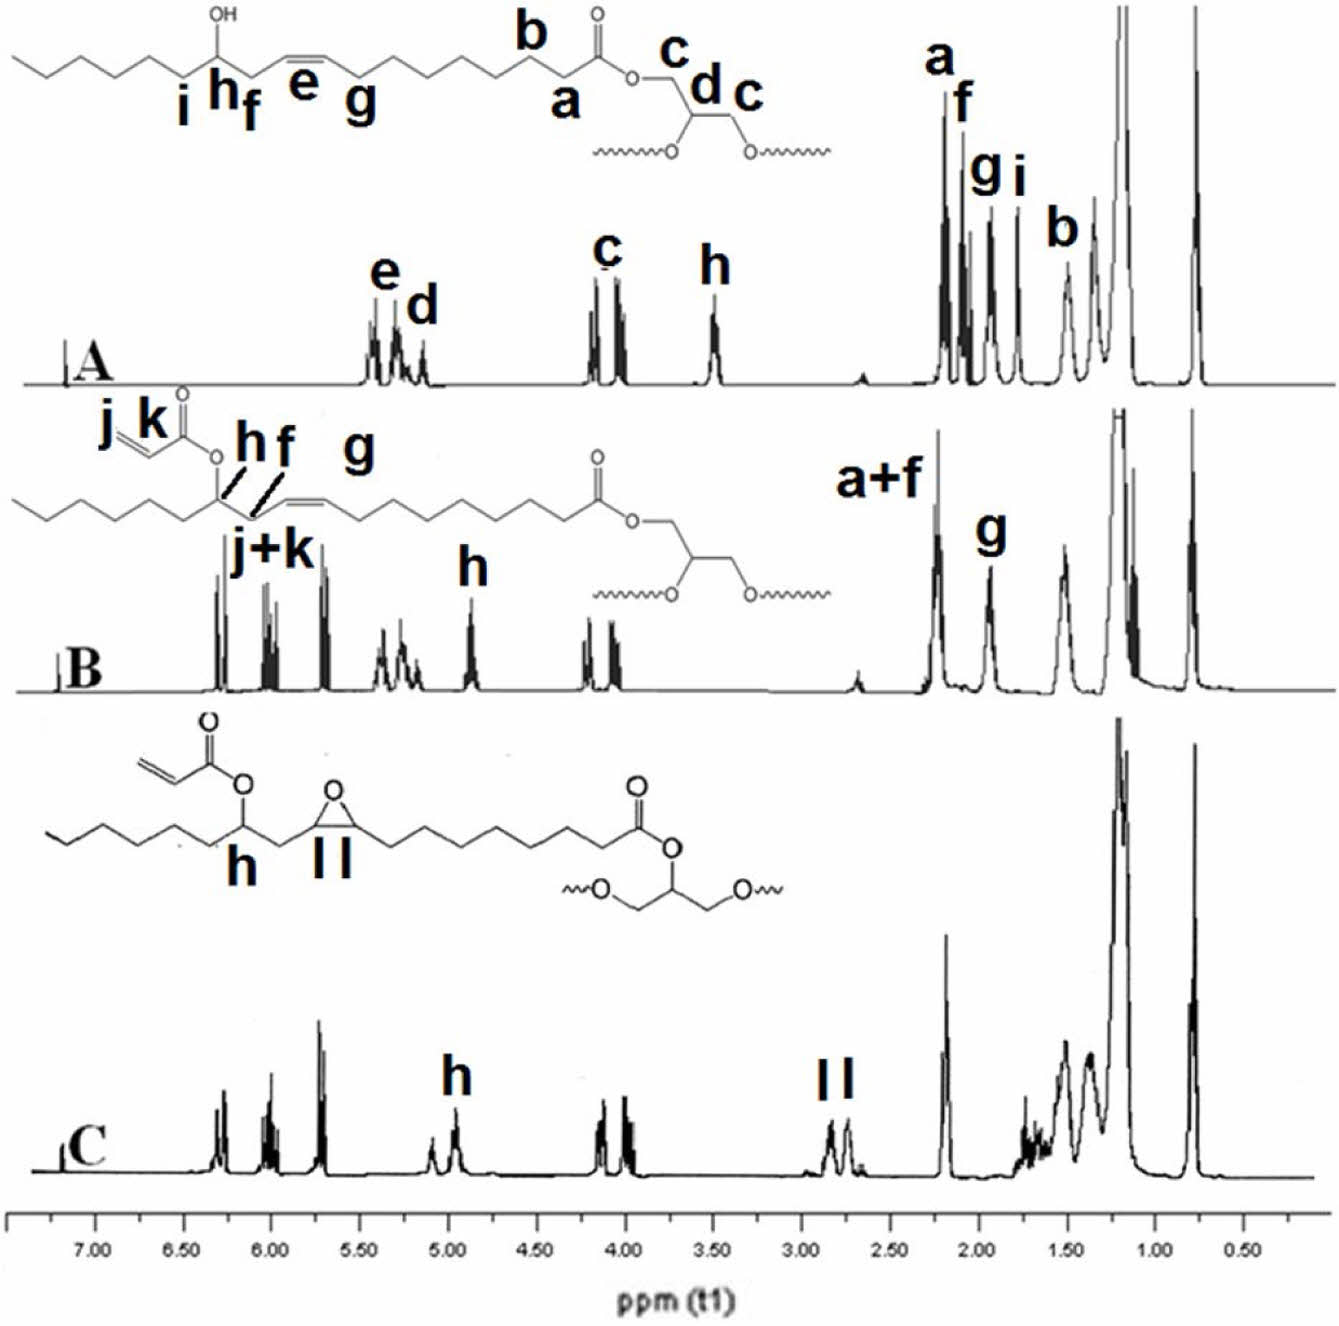
Figure 8 illustrates the 1H NMR spectrum of epoxidized acrylated castor oil. The 1H NMR technique could readily monitor the changes that occurred during the synthesis. At a concentration of 5,3-5,5 ppm, the double bond hydrogens of castor oil were observed as two distinct multiplets. The hydrogens of the glycerin moiety were observed at 4.0, 4.2, and 5 ppm, respectively. The adjacent hydrogens to the -OH groups are illustrated at a wavelength of 3.5 ppm. After the acrylation, the hydrogens adjacent to the -OH groups underwent a transformation, resulting in the disappearance of these hydrogens. Additionally, a distinct peak at 4.6 ppm was observed. This demonstrated that all the -OH groups had been esterified. In addition, three new peaks are detectable at 6.4-6.2 and 5.6 ppm, suggesting the presence of an acrylate group. Determining the conversion of materials can also be achieved through the use of 1H NMR. To achieve that goal, integration ratios of the hydrogen atoms can be utilized. One of the most notable hydrogen references in a triglyceride molecule are the hydrogens of the glycerol residue, which can be observed at 4.0 and 4.5 ppm. There are four hydrogens per triglyceride. The integration ratio of acrylate hydrogens to the glycerol hydrogens in the case of ACO was approximately 2. Based on the results, it was noticed that about 2.7 moles of acrylate groups could effectively bind to one mole of castor oil triglyceride.
Upon completion of the epoxidation process, two distinct peaks emerged at 2.5 and 2.7 ppm, indicating the presence of hydrogen atoms within the oxirane rings. The integration ratio of the number of epoxide hydrogens to the number of glycerol hydrogens was determined to be 1.3 in EACO, indicating that nearly all of the double bonds of CO were successfully transformed into epoxide groups. Following acrylation, the peaks at 2.1 and 1.3 ppm vanished while a new peak at 5 ppm became evident. This demonstrated that all hydroxyl groups were converted into esters. Three additional peaks were observed at 6.3-6.0 and 5.5 ppm in the ACO spectra, indicating the presence of hydrogen atoms in the acrylic group. The integration ratio between acrylate hydrogens and α-methylene hydrogens was also determined. The ratio was approximately 1.5. This discovery suggested that every hydroxyl group was transformed into acrylate esters. After epoxidation reaction, two minor peaks were seen at 2.6 and 2.8 ppm. The peaks at 5.25 and 5.5 vanished as a result of the consumption of the double bonds. Furthermore, the reduction of the allylic hydrogens at 2 ppm was also observed. The integration ratio between epoxide hydrogens and α-methylene hydrogens was determined to be 0.95. This result indicated that almost all C=C double bonds were converted into epoxide groups.
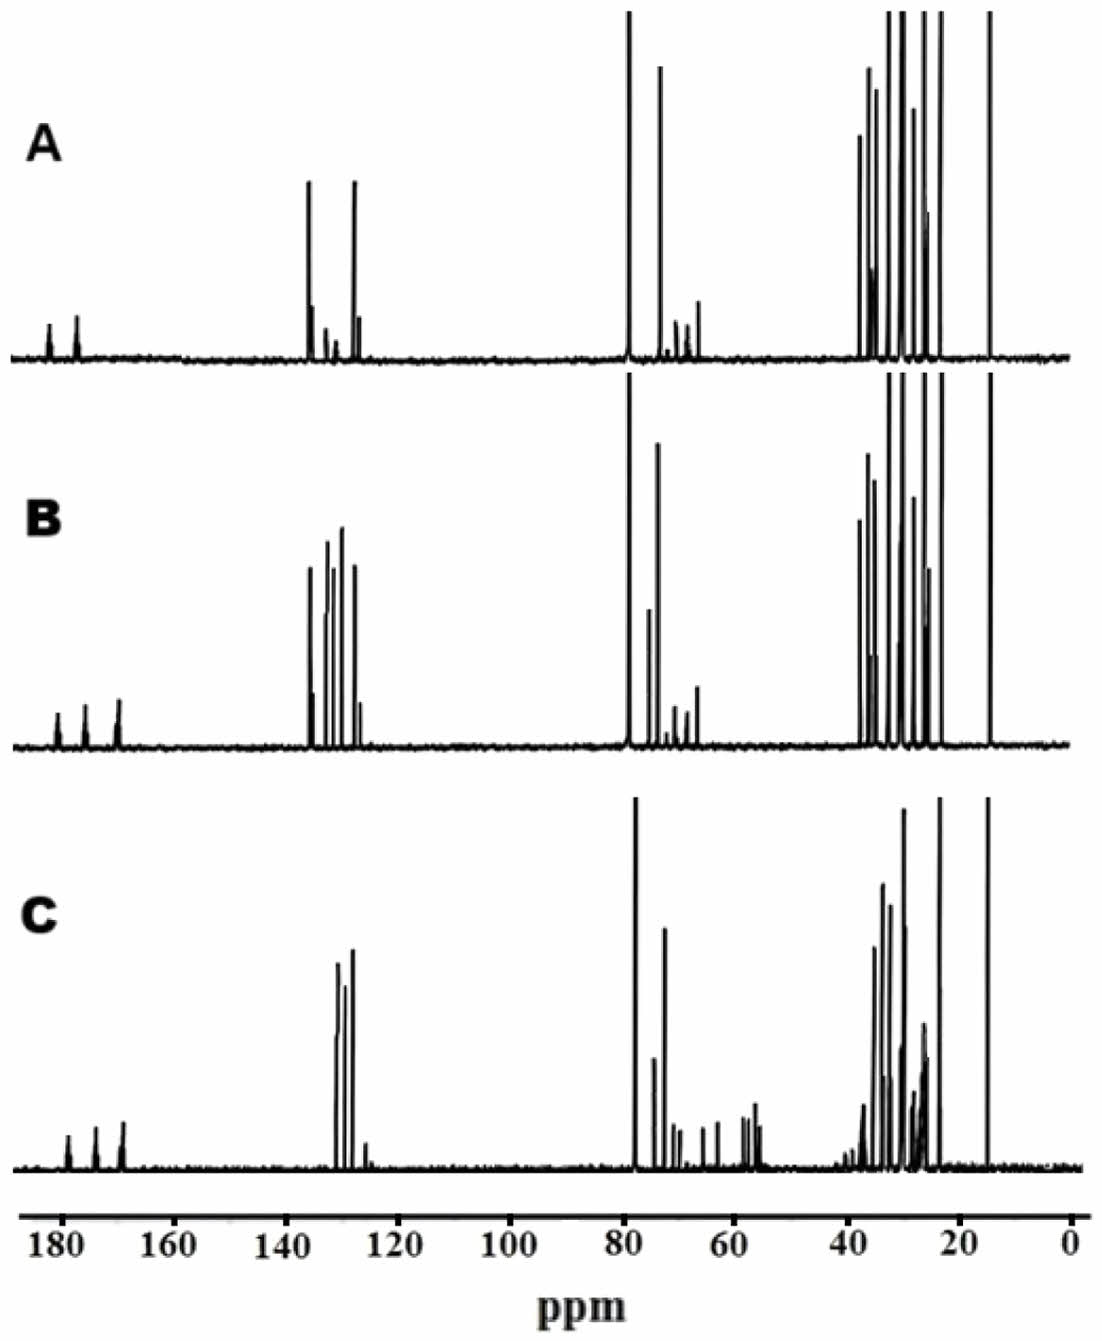
13C NMR spectra of castor oil, acrylated castor oil and epoxidized acrylated castor oil ars depicted in Figure 9. Castor oil is mainly composed of ricinoleic acid, and therefore, in the spectrum, saturated methylene carbons in the aliphatic chain are usually located between 20 and 40 ppm. While double bond carbons appear in the range of 125-135 ppm, the carbon atom adjacent to the hydroxyl group (e.g., secondary alcohol carbon at position C12) gives a peak at approximately 70-72 ppm. Ester carbonyl carbons originating from the triglyceride structure are observed around 175-180 ppm. In the case of acrylated derivative of castor oil, new sp2 carbon signals are added to the spectrum with the addition of the acrylate group. New peaks are observed between 125 and 135 ppm; the carbonyl carbon observed at 165 ppm. The presence of these groups confirms that the modification is successful. In addition, the methylene carbons of the newly bonded acrylic segment at the end of the chain also produce characteristic signals between 30 and 40 ppm. In acrylated epoxidized castor oil, the C=C double bonds of ricinoleic acid moiety are converted to epoxy rings and as a result of this transformation, some of the signals of the double bond carbons disappeared while the carbons attached to the oxygen in the epoxide ring create new signals around 55-60 ppm. At the same time, shifts occur in the methylene carbons adjacent to the epoxide ring, and these groups shift to around 35-45 ppm. As long as the carbonyl groups are not affected by the modification, they continue to be observed at 175-180 ppm, as in the original castor oil.
Synthesis and Characterization of Oleic Acid Coated Iron Oxide Nanoparticles. Coating iron oxide nanoparticles with oleic acid is an effective surface modification method that allows the nanoparticles to be more homogeneously distributed, especially in polymer matrices such as epoxy resins. Iron oxide nanoparticles are generally hydrophilic because they have hydroxyl groups on their surfaces, which leads to aggregation and poor dispersion problems in organic solvents or organic matrices (e.g., epoxy resins). These problems negatively affect the mechanical, thermal, and electrical properties of the composite material. Oleic acid is a long-chain unsaturated fatty acid and adheres strongly to the iron oxide nanoparticle surface via the bonding of the carboxyl group with the iron oxide surface. The long aliphatic chain of oleic acid creates a hydrophobic outer surface. This structure reduces the van der Waals attraction of the nanoparticles with each other and thus reduces the risk of agglomeration, and allows them to interact better with organic phases such as epoxy resin. As a result, oleic acid-coated iron oxide nanoparticles are more homogeneously dispersed in the epoxy resin matrix. It was stated that oleic acid-modified iron oxide nanoparticles were better dispersed in epoxy resin, resulting in an increase in the mechanical strength.43-45 Those literature was also congruent with our findings. Phase separation was observed uncoated iron oxide nano particle containing bio-based epoxy paints even in 1% concentration. When oleic acid modification was performed, homogeneous paints were obtained. reported that oleic acid-coated magnetic nanoparticles did not agglomerate in epoxy resin, and the dispersion was quite homogeneous.
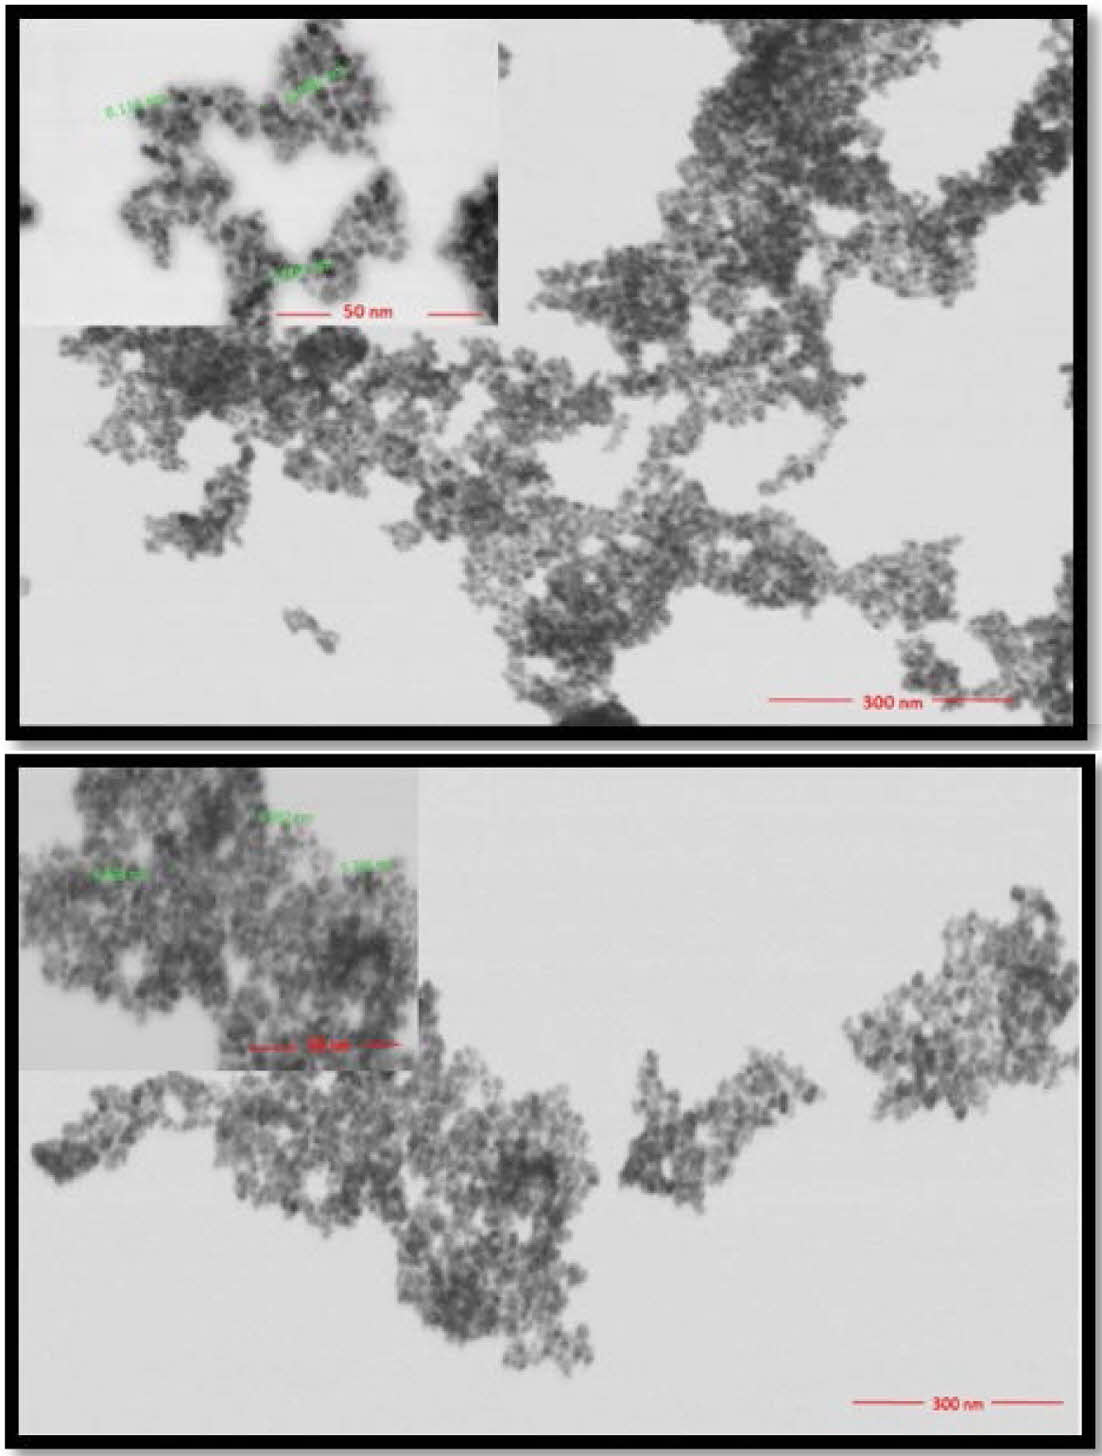
High-resolution surface characterization of IONP and oleic acid coated IONP was performed by using FE-SEM/STEM under high vacuum. Each nanoparticle was suspended in water at a ratio of 1/10 and dropped onto a carbon film-coated copper grid (TED PELLA, Pure carbon film 300M Cu). Images were taken at 300 nm-50 nm scales using 30 kV and 1 spot size. STEM images of the materials synthesized are shown in Figure 10. The combination of FeCl3·6H2O and FeCl2·4H2O produced nanoparticles with a spherical shape and a size of approximately 7 nm. After undergoing the modification process using oleic acid, the globular structure remained intact, albeit with an increase in particle size to approximately 9 nm.
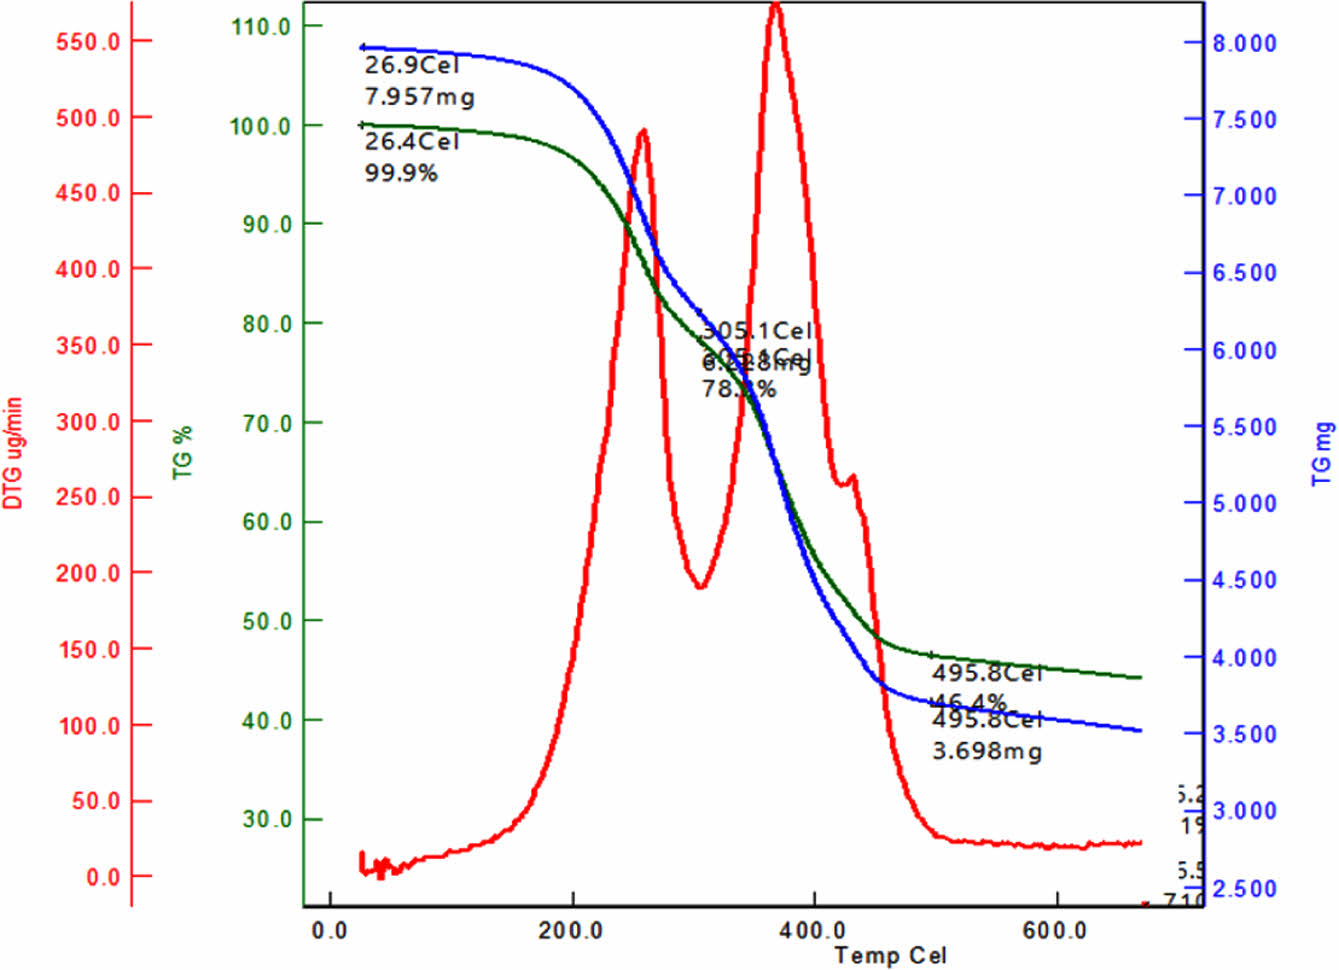
TGA technique was also used to characterize iron oxide nanoparticles. TGA analysis is conducted using the TA Q50 instrument with a heating rate of 10 ℃/min in a nitrogen atmosphere. Thermogravimetric analysis is conducted on iron oxide nanoparticles covered with a protective layer. The analysis is carried out in a nitrogen atmosphere, with a heating rate of 10 ℃ per minute, starting at ambient temperature and reaching a maximum temperature of 700 ℃. The TGA thermogram, which is depicted in Figure 11, indicated that iron oxide nanoparticles coated with oleic acid exhibited two distinctive weight loss at temperatures at 205 ℃ and 305 ℃.40 Char yield of coated iron oxide nanoparticles was measured 45% at 700 ℃.
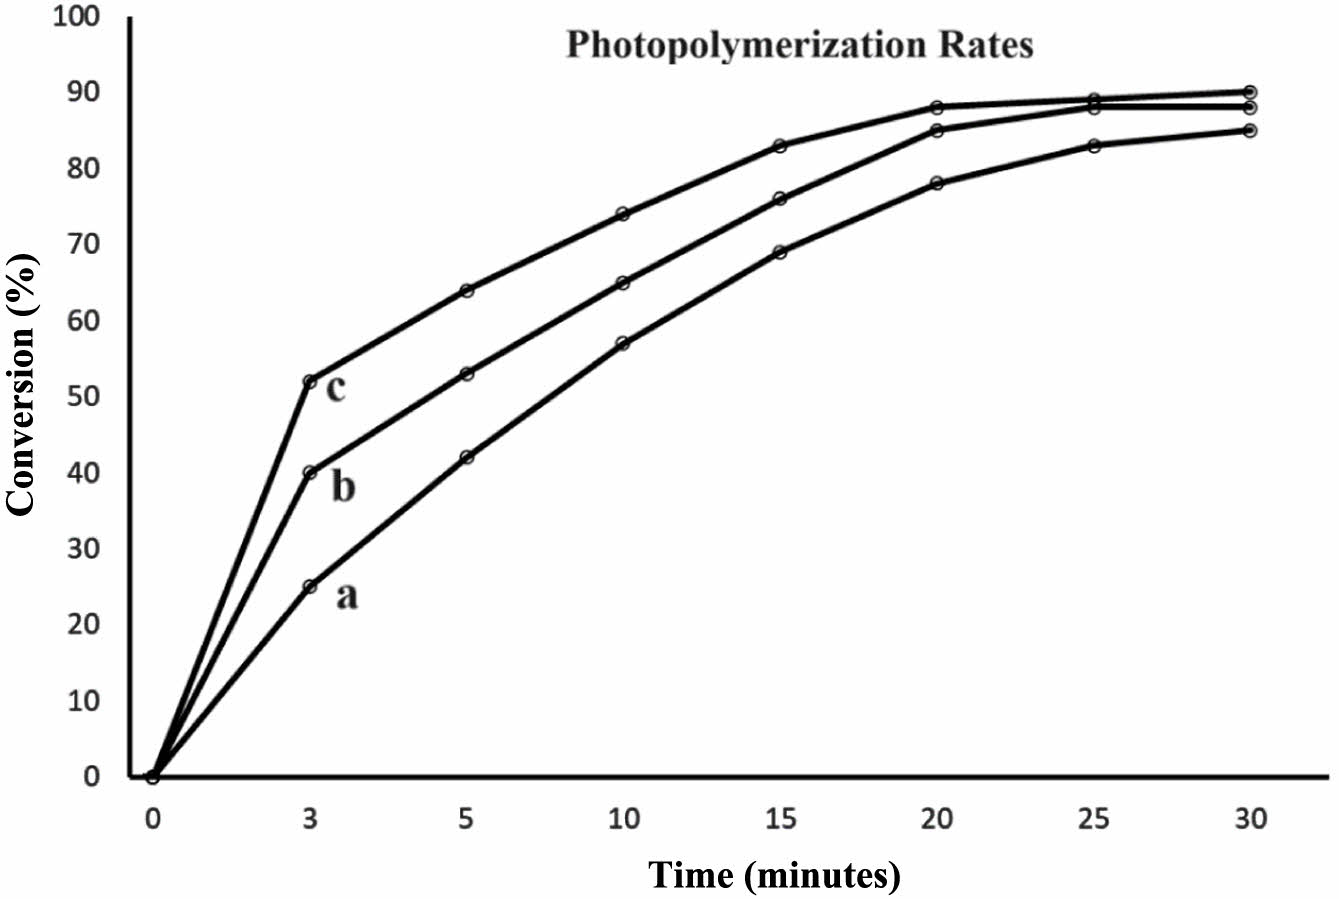
Photopolymerization of Bio-Based Resin. The photopolymerization of the bio-based resin was investigated utilizing one by one mixture of DMPA and AIBN as initiator. The initiators were completely dissolved in the smallest possible quantity of solvent. Ethyl acetate was used as a solvent because of its low toxicity and its capacity to dissolve the initiators. At ambient temperature, the process of polymerization occurred rapidly, resulting in the formation of first gels within a span of 3 minutes. This was achieved by utilizing an initiator concentration equivalent to 0.5% of the monomer’s weight. Maximum conversions were achieved within a duration of 30 minutes. Figure 12 demonstrates that the photopolymerization rate of monomer mixture. The EACO-AA polymer achieved its maximum conversion rate at 85%.
Eren and colleagues conducted a study on the polymerization of bromoacrylate monomers derived from fatty acids, in the presence of DMPA.46-47 Both experiments conducted polymerization at a wavelength of 360 nm. As a result of photopolymerization, they got linear polymers of bromoacrylated methyl oleate in the form of a thick liquid. Cakir et al. documented the process of using photopolymerization to create biobased hydrogels from acrylated methyl ricinoleate and epoxidized oleyl acrylate. In addition, they assessed the reaction conditions and many aspects that impact the quality of hydrogels.48,49 Kousaalya et al. conducted a kinetic analysis using photocolorimetry and observed a shift in the cure mechanism from kinetic-controlled to diffusion-controlled as the reaction progressed. The reaction termination mechanism was found to be a combination of second-order and primary radical termination mechanisms.50 Rosace and coworkers used acrylated epoxidized soybean oil with petroleum-based photo sensitive acrylates in order to reduce the negative environmental impact of the fossil-based materials.51 Additionally, Cayli and coworkers also studied photopolymerization of epoxidized acrylated castor oil by using AIBN and DMPA separately and they were reported that DMPA was a better photo initiator when compared to AIBN.52 This work demonstrated that the combined application of AIBN and DMPA initiators yields better outcomes compared to their individual usages. They can serve as both photoinitiators and thermal initiators. These initiator mixtures achieved a conversion rate of over 50% in less than 10 minutes. The subsequent thermal polymerization degraded the residual AIBN, leading to a higher polymerization percentage.
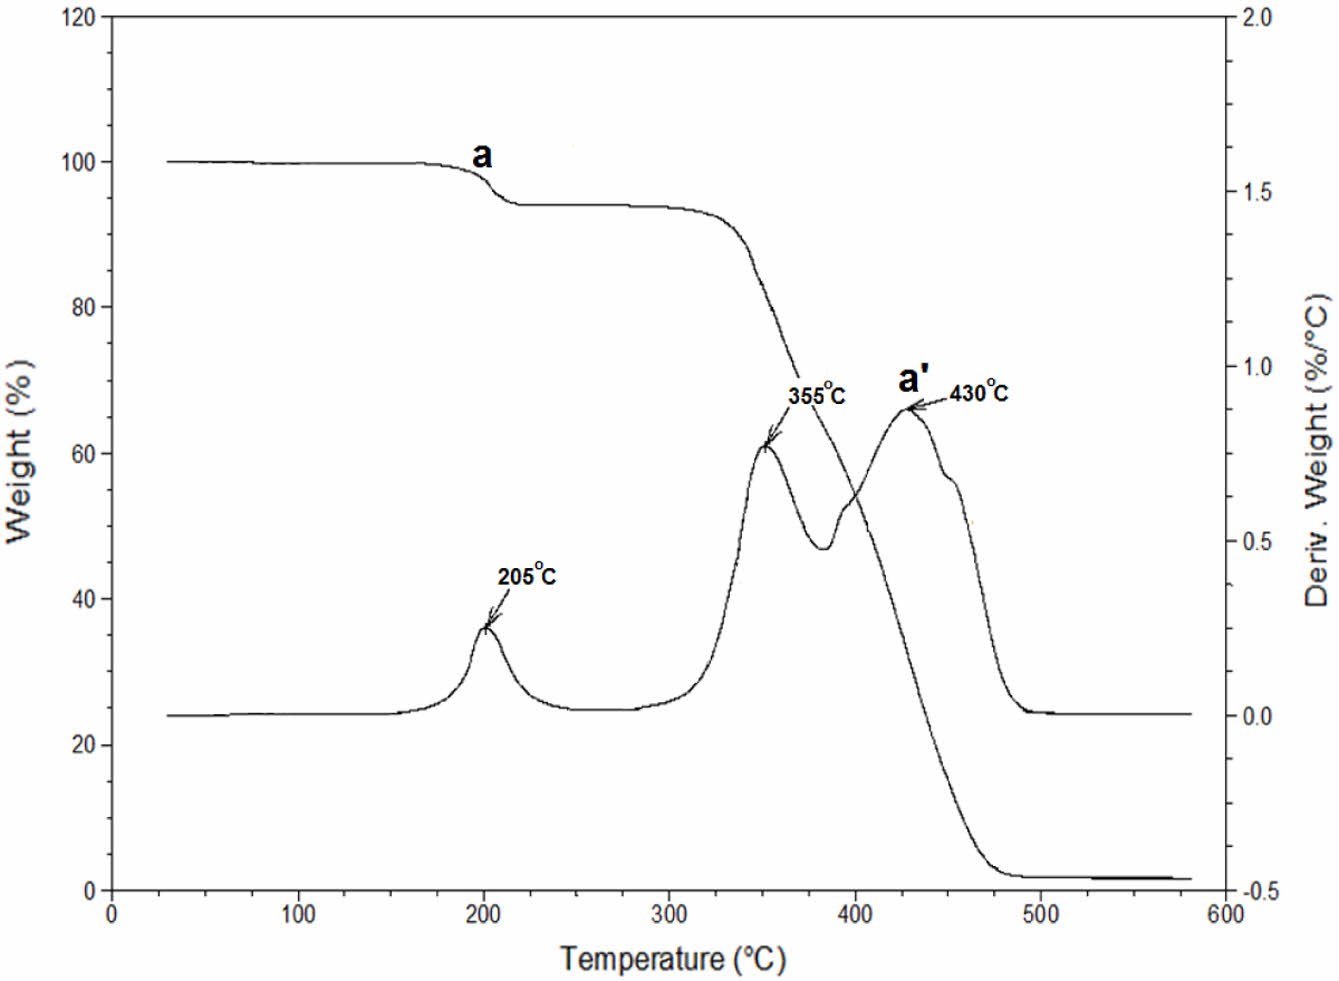
Thermal Properties of the Bio-based Epoxy Resin. Differential thermal characterization (DSC) and thermogravimetric analysis (TGA) methods were used to evaluate the thermal characterization of the polymer synthesized. TGA thermograms of the bio-based paint matrix is shown in the Figure 13. As a thermal stability indicator, 5% and 50% weight loss temperatures are generally used.53 The highest 5% weight loss temperature observed at 332 ℃. Moreover, bio-based paint matrix exhibited 50% weight loss temperature at 407 ℃. Another important data that obtained from TGA thermograms is the derivative TGA curves. That curves can be used as an indicator about weight loss per ℃. If that value is high that means the thermal degradation rate of the material is high. Derivative thermograms of the EACO is depicted in Figure 13. The highest derivative peak was observed at 331 ℃ with a 1.75% weight loss per ℃. Bio-based neat matrix exhibited 2 main degradation peaks at 352 and 427 ℃ with a 0.75 and 0.83% weight loss per ℃.
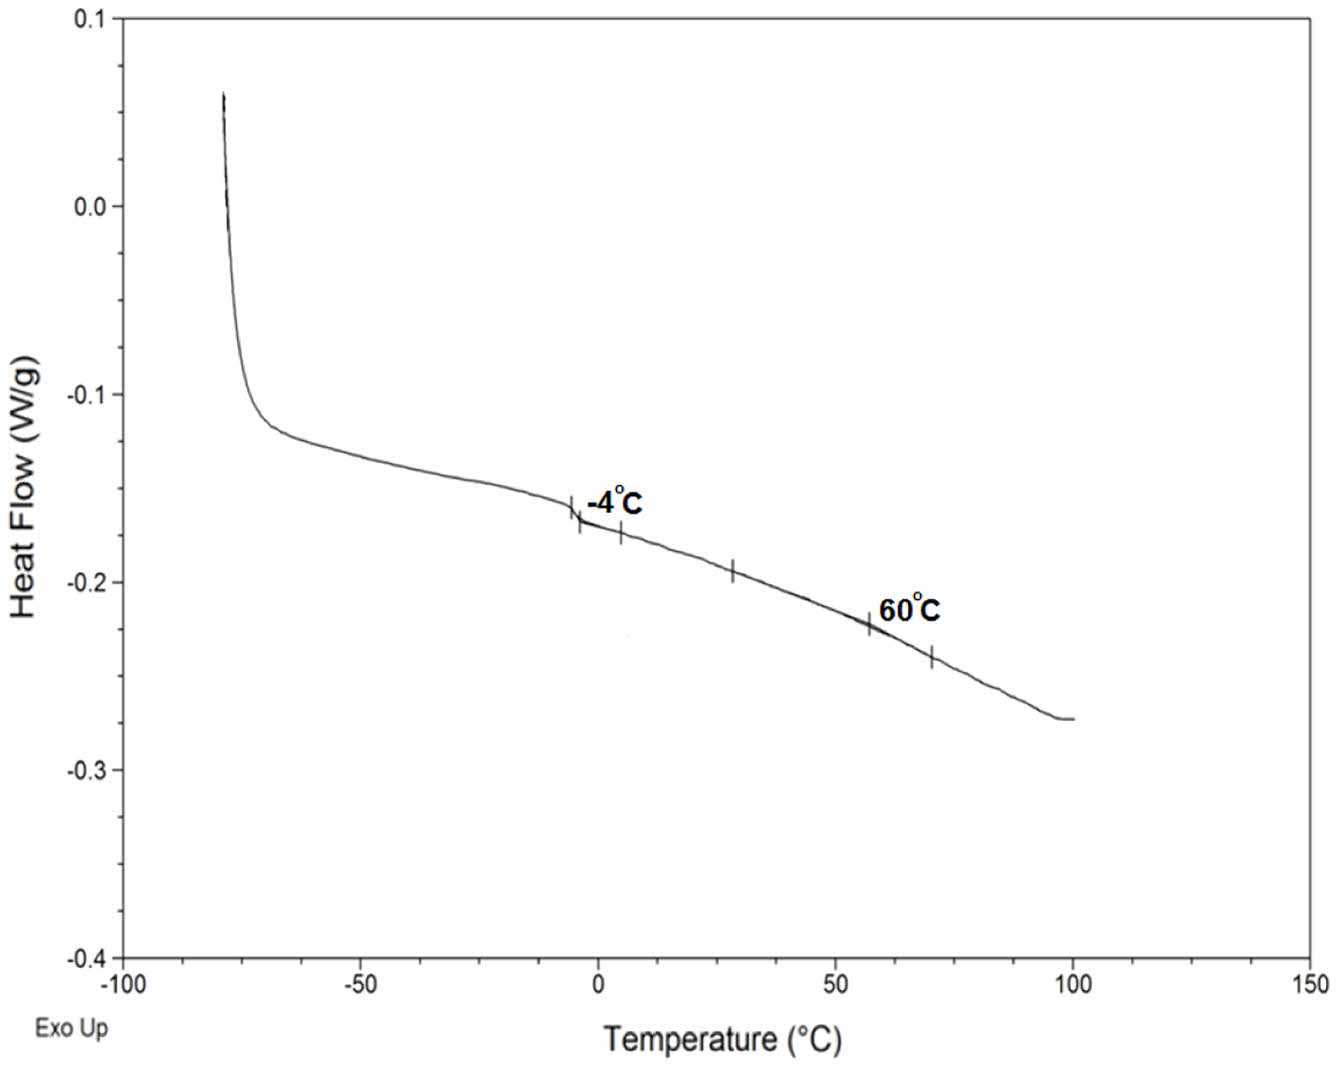
Another thermal characterization technique is DSC. Glass transition temperature and melting behavior of the polymeric materials can be determined by this method. DSC traces of the Epoxy paint matrix is presented in Figure 14. The matrix showed two Tg at -3.8 and 57 ℃ respectively.
EMF Results. Experiments are carried out under controlled conditions, ensuring that the same EMF meter, load, distance, temperature, and other factors remain constant. EMF strength is determined by measuring the electrical field and magnetic field.
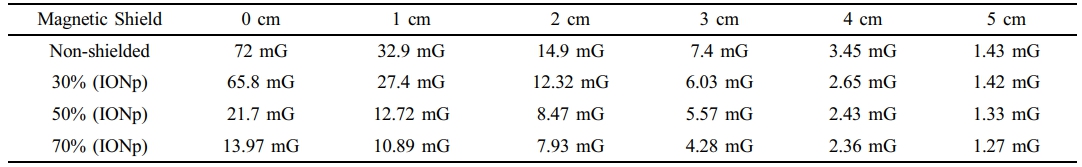
Electrical Cord Measurements. The electrical cord is coated with magnetic paint, which contains different quantities of IONP’s. Cable sections that are not protected and have been coated with bio-based epoxy paint that contained 30%, 50%, and 70% IONP’s are tested. The load current is measured at 8.93A and maintained at a constant value for all samples. The EMF meter is moved at varying distances from the cable, and the related EMF values are documented. Table 1 presents the recorded magnetic field measurements of the electrical cord.
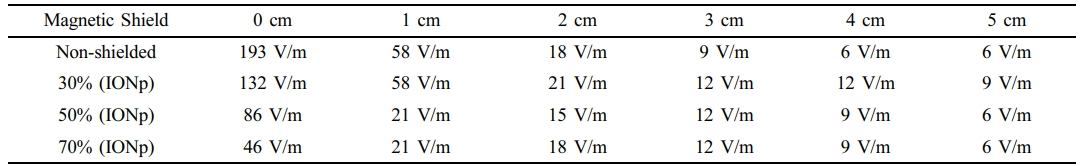
The results have verified that the magnetic field surrounding the wire diminishes as the flux distance increases. Furthermore, the suggested use of iron oxide-based shielding paints has significantly reduced EMF exposure in the vicinity of electrical wires. Table 2 presents the measurements of the electric field surrounding the cord. The electrical field findings align with the magnetic field findings.
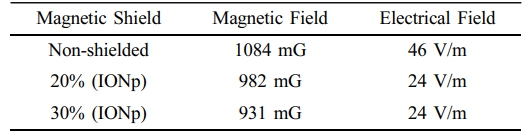
Control Transformer Measurements. The control transformer functioned in both loaded and open-circuit (unloaded) states. Conducting an open circuit test on a transformer allows us to determine the iron loss (also known as magnetic core losses) and observe the resulting rise in magnetic field effects.54,55 Cardboard boxes of standard size are employed to enclose the control transformer and maintain a fixed distance of 3 cm between the ferromagnetic core of the transformer and the EMF meter. Painted and unpainted boxes are used to replicate real-world situations for transformer applications. Cable sections that are not insulated and have been painted with a 20% solution, a 30% solution, and a 70% solution are subjected to testing, and the results are obtained. The EMF measurements of the control transformer without any load (open-circuit) are provided in Table 3.
Throughout the unloaded transformer testing, the primary current of the transformer, which is measured on the low voltage side at 110 V, is 0.96 A. The current in the secondary wiring is 0.48 A. The significance of these present levels is in their utilization in short-circuit testing to exploit the magnetizing effects of the core. Based on the findings, the control transformer exhibits notable EMF measurements. The magnetic shielding cardboard boxes can provide significant shielding (up to 11% for the 30% solution) for the transformer. Table 4 contains the EMF measurements of the control transformer under load.
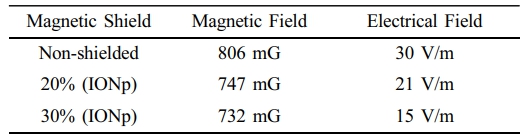
The loaded transformer tests determine the primary current of the transformer to be 8.10 A, whereas the current in the secondary wiring is around 4.05 A. The findings indicate that control transformers have lower EMF intensities in comparison to unloaded transformers, where the majority of the input power is dissipated by the load. Magnetic shielding remains effective in significantly limiting magnetic exposure to the core.
|
Figure 7 FTIR spectrum of a-castor oil, b-acrylated castor oil and c-epoxidized acrylated castor oil. |
|
Figure 8 1H NMR spectrum of A-castor oil, B- acrylated castor oil and C-epoxidized acrylated castor oil. |
|
Figure 9 13C NMR spectrum of A-castor oil, B- acrylated castor oil and C-epoxidized acrylated castor oil. |
|
Figure 10 STEM images of (a) IONP; (b) Oleic acid coated IONP. |
|
Figure 11 TGA and TGA derivative curves of oleic acid modified iron oxide nanoparticles. |
|
Figure 12 Photopolymerization rates of bio-based epoxy resin with a-0.5% photoinitiator, b-1% photoinitiator, a-3% photoinitiator. |
|
Figure 13 TGA thermogram: (a) and derivative TGA curves (a’) of bio-based epoxy paint matrix. |
|
Figure 14 DSC curves of bio-based epoxy paint matrix. |
|
Table 1 Measurements of the Magnetic Field (B) of an Elec tric al Wire At Various Distanc es Compared to Different Amount of Iron Oxide Nanoparticle (IONp) % |
|
Table 2 Measurements of the Electrical Field of an Electrical Cord at Various Distances Compared to Different Magnetic Paint Solutions |
|
Table 3 EMF Measurements of Control Transformers (unloaded) for Different Magnetic Paints |
|
Table 4 Measuring Electromagnetic Field (EMF) Levels of Loaded Control Transformers with Different Magnetic Paints |
In summary, we have successfully developed bio-based epoxy paints filled with modified IONP’s for enhanced electromagnetic shielding performance. The high magnetic saturation of the iron oxide nanoparticles and their uniform dispersion in the bio-based epoxy matrix resulted in excellent electromagnetic shielding effectiveness, making these bio-based epoxy paints promising candidates for various electronic and energy-related applications.
This study aims to examine EMF disturbances emanating from electrical networks by testing the most often encountered components of the grid, namely transformers and electrical cords, using paints that include suggested iron oxide nanoparticles. The paints containing iron oxide nanoparticles have effectively provided satisfactory shielding results for both the control transformer and the electrical cord. Furthermore, a decrease in electrical field intensity is observed in addition to magnetic field reduction. Applying proposed bio-based epoxy paints to electrical networks, especially domestic wiring or appliances, can also be possible. Moreover, the synthesized paints could serve as ideal materials for enhancing shielding effectiveness by the inclusion of supplementary particles.
- 1. Habib, S.A.; Saafan, S. A.; Meaz, T. M.; Darwish, M. A.; Zhou, D.; Khandaker, M. U.; Islam, M. A.; Mohafez, H.; Trukhanov, A. V.; Trukhanov, S. V. Structural, Magnetic, and AC Measurements of Nanoferrites/Graphene Composites. Nanomaterials 2022, 12, 931.
-

- 2. Qamar, S.; Yasin, S.; Ramzan, N.; Umer, A.; Akhtar, M. N. Structural, Morphological and Magnetic Characterization of Synthesized Co-Ce Doped Ni Ferrite/Graphene/BNO12 Nanocomposites for Practical Applications. Chin. J. Phys. 2020, 65, 82-92.
-
- 3. Srinivasan, S. Y.; Paknikar, K. M.; Bodas, D.; Gajbhiye, V. Applications of Cobalt Ferrite Nanoparticles in Biomedical Nanotechnology. Nanomedicine 2018, 13, 1221-1238.
-
- 4. Sunaryono, S.; Saputra, K.; Andina, R. I.; Hidayat, N.; Taufiq, A.; Susanto, H.; Mufti, N.; Hidayat, A.; Yogihati, C. I.; Triwicaksono, S.; Soontaranon, S. Effect of Polyethylene Glycol (PEG) on Particle Distribution of Mn0.25Fe2.75O4-PEG 6000 Nanoparticles. IOP Conf. Series J. Phys. Conf. 2018, 1093, 012005.
-
- 5. Narendhar, C.; Thomas, A.; Bali, J.; Kumar, S. M. M.; Regitha, M. Facile Synthesis of Carboxy Methyl Chitosan Coated Iron Oxide Nanoparticles and Their Antimicrobial Activity. Int. Conference on Adv. Nanomat. Emerg. Eng. Technol. 2013, 290-292.
-
- 6. Hamouda, S.; Amneenah, N. Electromagnetic Interference Impacts on Electronic Systems and Regulations. Int. J. Adv. Multidisciplinary Res. Studies, 2024, 4, 124-127.
- 7. Li, H.; Li, L.; Liu, J. Application of Nano Material for Shielding Power-frequency Electromagnetic Field. IOP Conference Series: Mater. Sci. Eng. 2015, 87, 012013.
-
- 8. Urbinello, D.; Joseph, W.; Huss, A.; Verloock, L.; Beekhuizen, J.; Vermeulen, R.; Martens, L.; Röösli, M. Radio-frequency Electromagnetic Field (RF-EMF) Exposure Levels in Different European Outdoor Urban Environments in Comparison with Regulatory Limits. Environ. Int. 2014, 68, 49-54.
-
- 9. Idris, F. M.; Hashim, M.; Abbas, Z.; Ismail, I.; Nazlan, R.; Ibrahim, I. R. Recent Developments of Smart Electromagnetic Absorbers-based Polymer-composites at Gigahertz Frequencies. J. Mag. Mag. Mater. 2016, 405, 197-208.
-
- 10. Kuznetsov, B. I.; Nikitina, T. B.; Voloshko, A. V.; Bovdyj, I. V.; Kobilyanskiy, B. B. Single-circuit Active Screening of Magnetic Field Generated by Several Overhead Transmission Lines in Residential Area. Electrical Eng. Electromech. 2018, 1, 41-45.
-
- 11. Iagăr, A.; Popa, G. N.; Diniş, C. M. Study of Electromagnetic Radiation Produced by Household Equipment. IOP Conf. Ser. Mater. Sci. Eng. 2017, 200, 012014.
-
- 12. Sudiarto, B.; Widyanto, A. N.; Hirsch, H. Effect of Standby Mode Operation of Some Household Appliances on Disturbance Voltage and Current in the Frequency Range of 9–150 kHz Produced by Other Equipment in Low Voltage Network. 2016 International Symposium on Electromagnetic Compatibility - EMC EUROPE, Wroclaw, Poland, 2016, 722-725.
-
- 13. Muramatsu, K.; Gao, Y.; Moriyama, Y.; Dozono, H.; Nishino, T.; Miura, K. Modeling of Leakage Magnetic Field of Electric Machines Using Blocks with Magnetizations for Design of Magnetically Shielded Room. 2016 IEEE Conference on Electromagnetic Field Computation (CEFC), Miami, FL, USA, 2016, pp. 1-1, DOI: 10.1109/ CEFC.2016.7816377.
-
- 14. Tang, Q.; Wang, Z.; Anderson, P. I.; Jarman, P.; Moses, A. J. Approximation and Prediction of AC Magnetization Curves for Power Transformer Core Analysis. IEEE Trans. Magn. 2015, 51, 8400708.
-
- 15. European Commission. Potential Health Effects of Exposure to Electromagnetic Fields (EMF). 2015, DOI: 10.2772/75635.
- 16. Chung, D. D. L. Materials for Electromagnetic Interference Shielding. J. Mater. Eng. Perform. 2000, 9, 350-354.
- 17. Alexandru, M.; Fartinescu, C. G.; Popescu, C. L.; Popescu, M. O. Shielding of Magnetic Field Produced by Energized Cables. 10th Int. Sympos. Adv. Topics in Electrical Eng. 2017, 378-381.
-
- 18. Al-Sarray, E.; Akkurt, İ.; Günoğlu, K.; Evcin, A.; Bezir, N. Ç. Radiation Shielding Properties of Some Composite Panel. Acta Phys. Pol. A 2017, 132, 490-492.
-
- 19. Laslouni, W.; Azzaz, M. Electromagnetic Properties in Nanostructured Alloy Cu70Co30 Obtained by a Non-Equilibrium Method. Acta Phys. Pol. A 2016, 30, 112-114.
-
- 20. Erdem, S.; Öksüzoğlu, R. M.; Avşar, S. B.; Erdem, B. Magnetic Mesoporous Silica Nanocomposite for Biodiesel Production. Acta Phys. Pol. A 2017, 132, 763-766.
-
- 21. Ding, Z.; Shi, S. Q.; Zang, H.; Cai, L. Electromagnetic Shielding Properties of Iron Oxide Impregnated Kenaf Bast Fiberboard. Compos. B Eng. 2015, 78, 266-271.
-
- 22. Azadmanjiri, J.; Hojati‐Talemi, P.; Simon, G. P.; Suzuki, K.; Selomulya, C. Synthesis and Electromagnetic Interference Shielding Properties of Iron Oxide/Polypyrrole Nanocomposites. Polym. Eng. Sci. 2010, 51, 247-253.
-
- 23. Srinivasan, K.; Samuel, E.; Jabaseelan, J. Evaluation of Radiation Shielding Properties of the Polyvinyl Alcohol/Iron Oxide Polymer Composite. J. Med. Phys. 2017, 42, 273-278.
-
- 24. Teja, A. S.; Koh, P. Y. Synthesis, Properties, and Applications of Magnetic Iron Oxide Nanoparticles. Prog. Cryst. Growth Charact. 2009, 55, 22-45.
-
- 25. Abushrida, A.; Elhuni, I.; Taresco, V.; Marciani, L.; Stolnik, S.; Garnett, M. C. A Simple and Efficient Method for Polymer Coating of Iron Oxide Nanoparticles. J. Drug Deliv. Sci. Technol. 2020, 55, 101460.
-
- 26. Benjamin, C. M.; Aguilar-Bolados, H.; Geshev, J.; Quíjada, R. Study of the Influence of Magnetite Nanoparticles Supported on Thermally Reduced Graphene Oxide as Filler on the Mechanical and Magnetic Properties of Polypropylene and Polylactic Acid Nanocomposites. Polymers 2021, 13, 1635.
-
- 27. Park, J.; Kadasala, N. R.; Abouelmagd, S. A.; Castanares, M. A.; Collins, D. S.; Wei, A.; Yeo, Y. Polymer–Iron Oxide Composite Nanoparticles for EPR-Independent Drug Delivery. Biomaterials 2016, 101, 285-295.
-
- 28. Auvergne, R. Caillol, S. David, G. Boutevin, B. Pascault, J. P. Biobased Thermosetting Epoxy: Present and Future. Chem. Rev. 2014, 114, 1082-1115.
-
- 29. Kiatsimkul, P. P.; Sutterlin, W. R.; Suppes, G. J. Selective Hydrolysis of Epoxidized Soybean Oil by Commercially Available Lipases: Effects of Epoxy Group on the Enzymatic Hydrolysis. J. Mol. Catal. B: Enzym. 2006, 41, 55-60.
-
- 30. Cavusoglu, J.; Cayli, G. Polymerization Reactions of Epoxidized Soybean Oil and Maleate Esters of Oil-Soluble Resoles. J. Appl. Polym. Sci. 2015, 132, 41457.
-
- 31. Hatir, P. C. Light-Induced Hydrogels Derived from Poly (Ethylene Glycol) and Acrylated Methyl Ricinoleate as Biomaterials. J. Appl. Polym. Sci. 2022, 139, e52754.
-
- 32. Mubofu, E. B. Castor Oil as a Potential Renewable Resource for the Production of Functional Materials. Sustain. Chem. Process. 2016, 4, 11.
-
- 33. Chauke, N. P.; Mukaya, H. E.; Nkazi, D. B. Chemical Modifications of Castor Oil: A Review. Sci. Prog. 2019, 102, 199-217.
-
- 34. Nekhavhambe, E.; Mukaya, H. E.; Nkazi, D. B. Development of Castor Oil–Based Polymers: A Review. J. Adv. Manuf. Process. 2019, 1, e10030.
-
- 35. Koca, E. I.; Bozdag, G.; Kazan, D.; Hatir, P. C. Thermoresponsive Hydrogels Based on Renewable Resources. J. Appl. Polym. Sci. 2020, 137, 48861.
-
- 36. Sahin, Y. M.; Cayli, G.; Cavusoglu, J.; Tekay, E.; Sen, S. Cross-Linkable Epoxidized Maleinated Castor Oil: A Renewable Resin Alternative to Unsaturated Polyesters. Int. J. Polym. Sci. 2016, 5781035.
-
- 37. Esen, H.; Çayli, G. Epoxidation and Polymerization of Acrylated Castor Oil. Eur. J. Lipid Sci. Technol. 2016, 118, 959-966.
-
- 38. Çayli, G.; Gürbüz, D.; Çınarli, A. Characterization and Polymerization of Epoxidized Methacrylated Castor Oil. Eur. J. Lipid Sci. Technol. 2019, 121, 1700189.
-
- 39. Damatopoulou, T.; Angelopoulos, S.; Christodoulou, C.; Gonos, I.; Kladas, A.; Hristoforou, E. Magnetic Shielding for Electric Car Power Cables. IEEE Trans. Magn. 2022, 59, 8500107.
-
- 40. Duc, H. B.; Minh, T. P.; Minh, D. B.; Hoai, N. P.; Quoc, V. D.; An Investigation of Magnetic Field Influence in Underground High Voltage Cable Shields. Eng. Technol. Appl. Sci. Res. 2022, 12, 8831-8836.
-
- 41. Quercio, M.; Barlassina L.; Canova, A. Characterization of the Shielding Properties of a Power Transformer Enclosure. IEEE EUROCON 2023-20th Int. Conference on Smart Technol. 2023, 349-353.
-
- 42. Nafar, M.; Solookinejad, G.; Jabbari, M. Magnetic Field Calculation of 63KV Transmission Lines. Int. J. Res. Rev. Appl. Sci. 2013, 17, 218-224.
- 43. Das, A. K.; Fanan, A.; Ali, D.; Solanki, V. S.; Pare, B.; Almutairi, B. O.; Agrawal, N.; Yadav, N.; Pareek, V.; Yadav, V. K. Green Synthesis of Unsaturated Fatty Acid Mediated Magnetite Nanoparticles and Their Structural and Magnetic Studies. Magnetochemistry 2022, 8, 174.
-
- 44. Hao, J.; Yang, K.; Wu, J.; Wu, M.; Li, Y. Overview of Recent Developments in Composite Epoxy Resin in Organic Coating on Steel (2020–2024). Materials, 2025, 18, 1531.
-
- 45. Pušnik Črešnar, K.; Vidal, J. Green Engineering of Bio-Epoxy Resin: Functionalized Iron-Oxide Nanoparticles for Enhanced Thermal, Mechanical, Surface and Magnetic Properties. Polymers, 2025, 17, 1819.
-
- 46. Eren, T.; Küsefoğlu, S. H. Synthesis and Characterization of Copolymers of Bromoacrylated Methyl Oleate. J. Appl. Polym. Sci. 2004, 94, 2475-2488.
-
- 47. Eren, T.; Küsefoğlu, S. H. Synthesis and Polymerization of the Bromoacrylated Plant Oil Triglycerides to Rigid, Flame-Retardant Polymers. J. Appl. Polym. Sci. 2004, 91, 2700-2710.
-
- 48. Hatir, P. C.; Cayli, G. Environmentally Friendly Synthesis and Photopolymerization of Acrylated Methyl Ricinoleate for Biomedical Applications. J. Appl. Polym. Sci. 2019, 136, 47969.
-
- 49. Çapan, O. Y.; Hatir, P. C. Synthesis, Characterization, and Biocompatibility of Plant-Oil Based Hydrogels. Trak. Univ. J. Nat. Sci. 2021, 22, 147-154.
-
- 50. Kousaalya, A. B.; Ayalew, B.; Pilla, S. Photopolymerization of Acrylated Epoxidized Soybean Oil: A Photocalorimetry-Based Kinetic Study. ACS Omega 2019, 4, 21799-21808.
-
- 51. Rosace, G.; Rosa, R. P.; Arrigo, R.; Malucelli, G. Photosensitive Acrylates Containing Bio-Based Epoxy-Acrylate Soybean Oil for 3D Printing Application. J. Appl. Polym. Sci. 2021, 138, e51292.
-
- 52. Cayli, G.; Cekli, S.; Uzunoğlu, C. P. Synthesis, Photopolymerization, and Evaluation of Electrical Properties of Epoxidized Castor Oil-Based Acrylates. Polym. Bull. 2024, 81, 13289-13304.
-
- 53. Ng, H. M.; Saidi, N. M.; Omar, F. S.; Ramesh, K.; Ramesh, S.; Bashir, S. Thermogravimetric Analysis of Polymers. In Encyclopedia of Polymer Science and Technology; John Wiley & Sons, Ltd.: Hoboken, 2018; pp 1-29.
-
- 54. Uzunoğlu, C. P.; Karhan, M. Quantization of Transformer Transient Waveforms under No-Load Conditions by Using Higuchi’s Method. UNITECH International Conference, 2017, 1, 166-170.
- 55. Cekli, S.; Uzunoğlu, C. P.; Ugur, M. Monofractal and Multifractal Analysis of Discharge Signals in Transformer Pressboards. Adv. Electr. Comput. Eng. 2018, 18, 69-76.
-
- Polymer(Korea) 폴리머
- Frequency : Bimonthly(odd)
ISSN 2234-8077(Online)
Abbr. Polym. Korea - 2025 Impact Factor : 1.0
- Indexed in SCIE
 This Article
-
2025; 49(6): 673-685
Published online Nov 25, 2025
- 10.7317/pk.2025.49.6.673
- Received on Nov 7, 2024
- Revised on Jul 16, 2025
- Accepted on Jul 18, 2025
Services
- Full Text PDF
- Abstract
- ToC
- Conflict of Interest
Introduction
Experimental
Results and Discussion
Conclusions
- References
Shared
Correspondence to
- Gökhan Çayli
-
Istanbul University-Cerrahpasa, Department of Engineering Sciences, Engineering Faculty,
Avcilar Campus, Istanbul, 34320, Turkey - E-mail: gokhan.cayli@iuc.edu.tr
- ORCID:
0000-0002-3395-5642
Hyecheon Building(Room 601), #354, Gangnam-Daero, Gangnam-Gu, Seoul 06242, Korea
TEL : 82-2-568-3860, 561-5203, 569-3860 FAX : 82-2553-6938 E-mail: polymer@polymer.or.kr