


- Comparison of Constant Ratio and Constant Composition Gas Feeding Modes in Olefin Gas-Phase Copolymerization
Zheng Zheng†

Zhejiang Industry Polytechnic College, 151 Qutun Road, Yuecheng District, Shaoxing, Zhejiang, China 312000
- 올레핀 기상 공중합에서 일정비율 및 일정조성 가스 공급 방식의 비교
Reproduction, stored in a retrieval system, or transmitted in any form of any part of this publication is permitted only by written permission from the Polymer Society of Korea.
The impact of constant ratio and constant composition gas feeding modes on the gas-phase copolymerization during preparation of polypropene in-reactor alloy was investigated. The polymerization behaviors under these two modes were compared by analyzing the molecular weight distribution, sequence structure distribution, thermal properties, and mechanical properties of the resulting polymers. It was found that the constant composition feeding mode effectively eliminated the copolymer composition drift, resulted in a narrower lamellar thickness distribution of the gas-phase products, and improved the polymer's toughness and elongation at break. Additionally, solvent fractionation results revealed that samples prepared under constant composition feeding had a higher mass fraction of Fraction B, which further enhanced the material’s toughness. These findings provide theoretical insights for optimizing gas feeding strategies in industrial production to enhance polymer product quality and performance.
The impact of constant-ratio and constant-composition gas feeding on polypropene in-reactor alloy formation was compared. Constant-composition feeding eliminated composition drift, narrowed lamellar distribution and enriched Fraction B, giving the alloy markedly higher toughness and elongation at break than the constant-ratio counterpart.
Keywords: olefin gas-phase copolymerization, constant ratio gas feeding, constant composition gas feeding, polymer properties.
This research was supported by the Research Project on the Integrated Development of Discipline-Specific Services at Zhejiang Industry Polytechnic College (Grant No. XKC202511003) and High-Level Talent Research Startup Fund of Zhejiang Industry Polytechnic College.
The authors declare that there is no conflict of interest.
In our previous studies on olefin gas-phase copolymerization, the distributed control system (DCS) can control the flow controllers on the intake lines to inject gases into the reactor in two modes. In the first mode, gases were controlled to flow into the reactor at a constant volume flow ratio (constant ratio gas feeding mode, using the described gas composition detection process).1 In the second mode, gases were injected into the reactor to maintain a constant atmosphere composition (constant composition gas feeding, using the described gas composition control process).2
In the constant ratio gas feeding mode, there was a drift in copolymer composition, while no such drift was observed in the constant composition gas feeding mode. The different trends in the reactor atmosphere composition inevitably affect the properties of the polymer products. In the constant ratio gas feeding mode, the drift in copolymer composition means that the instantaneous composition of the polymer product at different polymerization time points must be different. Compared to the constant composition gas feeding mode, the resulting polymer will have a broader copolymer composition distribution.3,4 Since the structure of the polymer determines its properties and vice versa, differences in the copolymer composition distribution, molecular weight distribution, and sequence structure distribution of the polymer also determine the differences in its macroscopic properties (such as thermal and mechanical properties).5-8
Chakravarti et al.9 studied the gas-phase copolymerization of ethylene and 1-hexene. Initially, 1-hexene was added only at the beginning of the reaction, and a significant drift in the reactor atmosphere composition was observed (the concentration of 1-hexene in the gas phase was decaying). Later, a gas composition control system developed by his research group (initially realized by Debling and Han-Adebekun using FTIR technology10,11 was used to control the feed of 1-hexene and maintain a constant concentration of 1-hexene in the gas phase for copolymerization experiments. This paper focused on the kinetics of polymerization and did not compare the structures and properties of the resulting polymers under the two polymerization modes. Jijiang Hu12 conducted ethylene/propylene copolymerization experiments under the constant composition gas feeding mode based on his self-developed gas composition control system and studied the kinetics of gas-phase copolymerization but did not perform copolymerization experiments under the constant ratio gas feeding mode. Ning Tan13 used a constant composition of ethylene/propylene mixed gas for feeding and found that after a short period (3-5 minutes), the reactor atmosphere composition reached a constant value and remained so until the end of polymerization. This system can also be considered as maintaining a constant reactor atmosphere composition, and subsequent studies focused on the kinetics of gas-phase copolymerization. To date, no published literature has been found comparing copolymerization under the constant ratio gas feeding mode and the constant composition gas feeding mode for gas-phase copolymerization during preparation of polypropene in-reactor alloy, especially in terms of the comparison of polymerization reaction behavior and the structures and properties of the resulting polymers, with a significant lack of comparisons in the structures and properties of the resulting polymers.
In this work, gas-phase copolymerization during preparation of polypropene in-reactor alloy was conducted under both constant ratio gas feeding and constant composition gas feeding modes, and the polymerization reaction behaviors under the two modes were compared. Through decoupling analysis of the alloy products, the molecular weight distribution and sequence structure distribution of the products in the gas-phase copolymerization was obtained. The thermal properties of the polymers were analyzed by continuous self-nucleation annealing to reflect the copolymer composition distribution of the gas-phase products. Mechanical property testing and solvent fractionation of the alloy products revealed the factors influencing the mechanical properties of the alloy. An in-depth comparison of the polymerization reaction behaviors and the structures and properties of the resulting polymers under these two gas feeding modes during the preparation of polypropylene in-reactor alloy is provided. This research addresses a significant gap in the literature regarding such comparisons.
The experimental materials and procedure were similar to those in our previous article.1,2 For the convenience of the reader, it is repeated here.
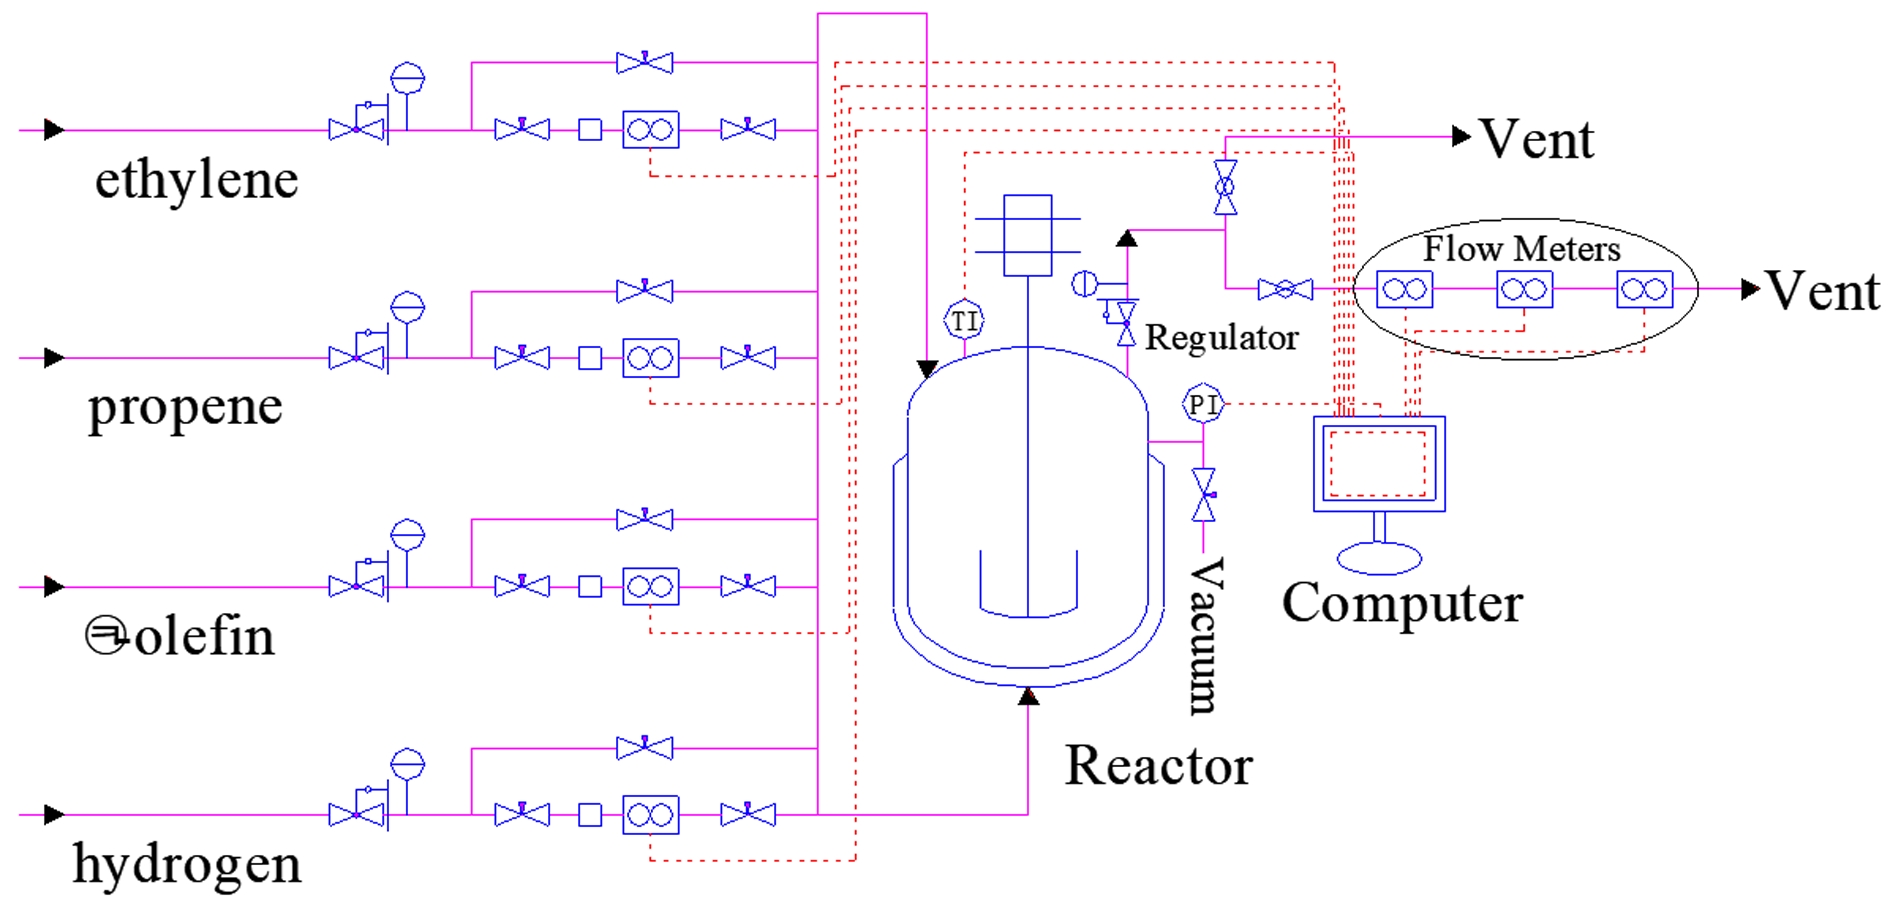
Materials and Devices. The experimental materials and their usage methods employed in this study are the same as those used in our previous work.1,2 n-Hexane (anhydrous, 95%, J&K Scientific, China) was used as a diluent. Triethylaluminum (TEA, 1 mol L-1 in n-hexane, AkzoNobel, the Netherlands) and cyclohexyl(methyl)dimethoxysilane (C-donor, 0.1 mol L-1 in n-hexane, TCI, Japan) served as a cocatalyst and external donor, respectively. The Ziegler-Natta catalyst (TiCl4/MgCl2, 60 mg batch-1, Beijing Research Institute of Chemical Industry, China) was employed in the slurry stage. The polypropylene/poly(ethylene-co-propylene) (PP/P(E-co-P)) in-reactor alloy was prepared using the described gas composition detection process1 and the described gas composition control process.2 The schematic diagram of the polymerization experimental apparatus can be found in our previous work and is shown in Figure 1 here.
Polymerization Procedure. The PP/P(E-co-P) in-reactor alloy was prepared via a two-stage polymerization process: the first stage involved slurry polymerization of propylene to produce polypropylene homopolymer particles with catalytic activity, while the second stage involved gas-phase copolymerization of ethylene and propylene to produce ethylene/propylene copolymers. The slurry polymerization conditions and steps for all the slurry homopolymerization stages are identical to those in our previous work. The gas-phase copolymerization of ethylene and propylene in the second stage was carried out using the gas composition detection and control processes in the reactor. The polymerization steps under the constant volume flow ratio mode (gases were controlled to flow into the reactor at a constant volume flow ratio) and the constant atmosphere composition mode (gases were injected into the reactor to maintain a constant atmosphere composition) are also the same as those described in our previous work and will not be repeated.
Polymer Characterization. The determination of the polymer molecular weights (Mn and Mw), molecular weight distribution (PDI = Mw/Mn), copolymer composition, differential scanning calorimetry (DSC) analysis of the polymer samples, and continuous self-nucleation annealing (SSA) analysis of the polymer samples were conducted in the same manner as in our previous work and will not be repeated.
The mechanical properties of the polymers were tested using low-temperature cantilever beam impact testing and tensile testing at room temperature. The preparation steps for the mechanical testing specimens are as follows: Mix approximately 50 g of polymer pellets with B215 antioxidant (Irganox 1010/Irgafos 168 1:1 w/w blend, BASF, Germany) at 0.8 wt%. The mixture was melt-blended in a torque rheometer (HAAKE MiniLab II, Thermo Fisher Scientific, USA) at 180 ℃, 60 rpm for 8 min. The extrudate was hot-cut into strips and compression-molded in a laboratory press (GT-7014-A50C, Gotech Testing Machines Co., Ltd., Taiwan, China) at 180 ℃. The molding cycle consisted of 8 min pre-heating without pressure, five press-vent cycles to 20 MPa, 3 min hold at 20 MPa, and cold-pressing under 20 MPa for 5 min using the built-in water-cooling platen. Impact specimens (80 × 10 × 4 mm3) were notched with a notching machine (QYJ1251, Ssans Material Testing Co., Ltd., China) to GB/T 1843-1996. Tensile specimens were die-cut to GB/T 528-2009 and conditioned at 23 ℃ for ³ 48 h. Low-temperature (-50 ℃) cantilever beam impact testing was performed on a CEAST 9050 pendulum impact tester (Instron, USA) with 5.5 J hammer according to GB/T 1843-1996. Room-temperature tensile testing was carried out on a Zwick/Roell Z020 universal testing machine (ZwickRoell Testing Technology (Shanghai) Co., Ltd., Germany) at 20 mm min-1 according to GB/T 528-2009. At least five specimens were tested for each sample, and average values are reported.
Fractionation of Polymer. The polymer solvent fractionation was performed in the same manner as in our previous work and will not be repeated.
|
Figure 1 Schematic diagram of the polymerization experimental apparatus.1,2 |
Polymerization Behavior. The PP/P(E-co-P) in-reactor alloy was synthesized using the previously described gas composition detection and control processes. The effects of constant ratio gas feeding (gases were controlled to flow into the reactor at a constant volume flow ratio) and constant composition gas feeding (gases were injected into the reactor to maintain a constant atmosphere composition), as well as the presence or absence of hydrogen, on the polymerization reaction behavior and polymer properties were compared. Table 1 lists the experimental conditions and polymerization results for the two-stage sequential polymerization to produce PP/P(E-co-P).
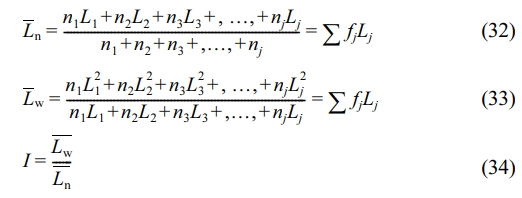
CFR1 corresponds to run 2 under the previous constant ratio gas feeding mode.1 CAC1 corresponds to run 3 under the previous constant composition gas feeding mode.2 When there was no hydrogen in the gas phase, ethylene/propylene copolymerization was also carried out under constant ratio gas feeding (CFR2) and constant composition gas feeding (CAC2) modes. Figure 2 shows the gas phase reactor atmosphere composition and the calculated instantaneous monomer consumption rate under CFR2 and CAC2.
Under CFR2 (constant ratio gas feeding without hydrogen), like CFR1 (constant ratio gas feeding with hydrogen), ethylene molar fraction in the reactor quickly drops to 0, meaning complete ethylene monomer consumption. Propylene molar fraction gradually rises to 1, indicating decreasing propylene consumption, which finally approaches 0.
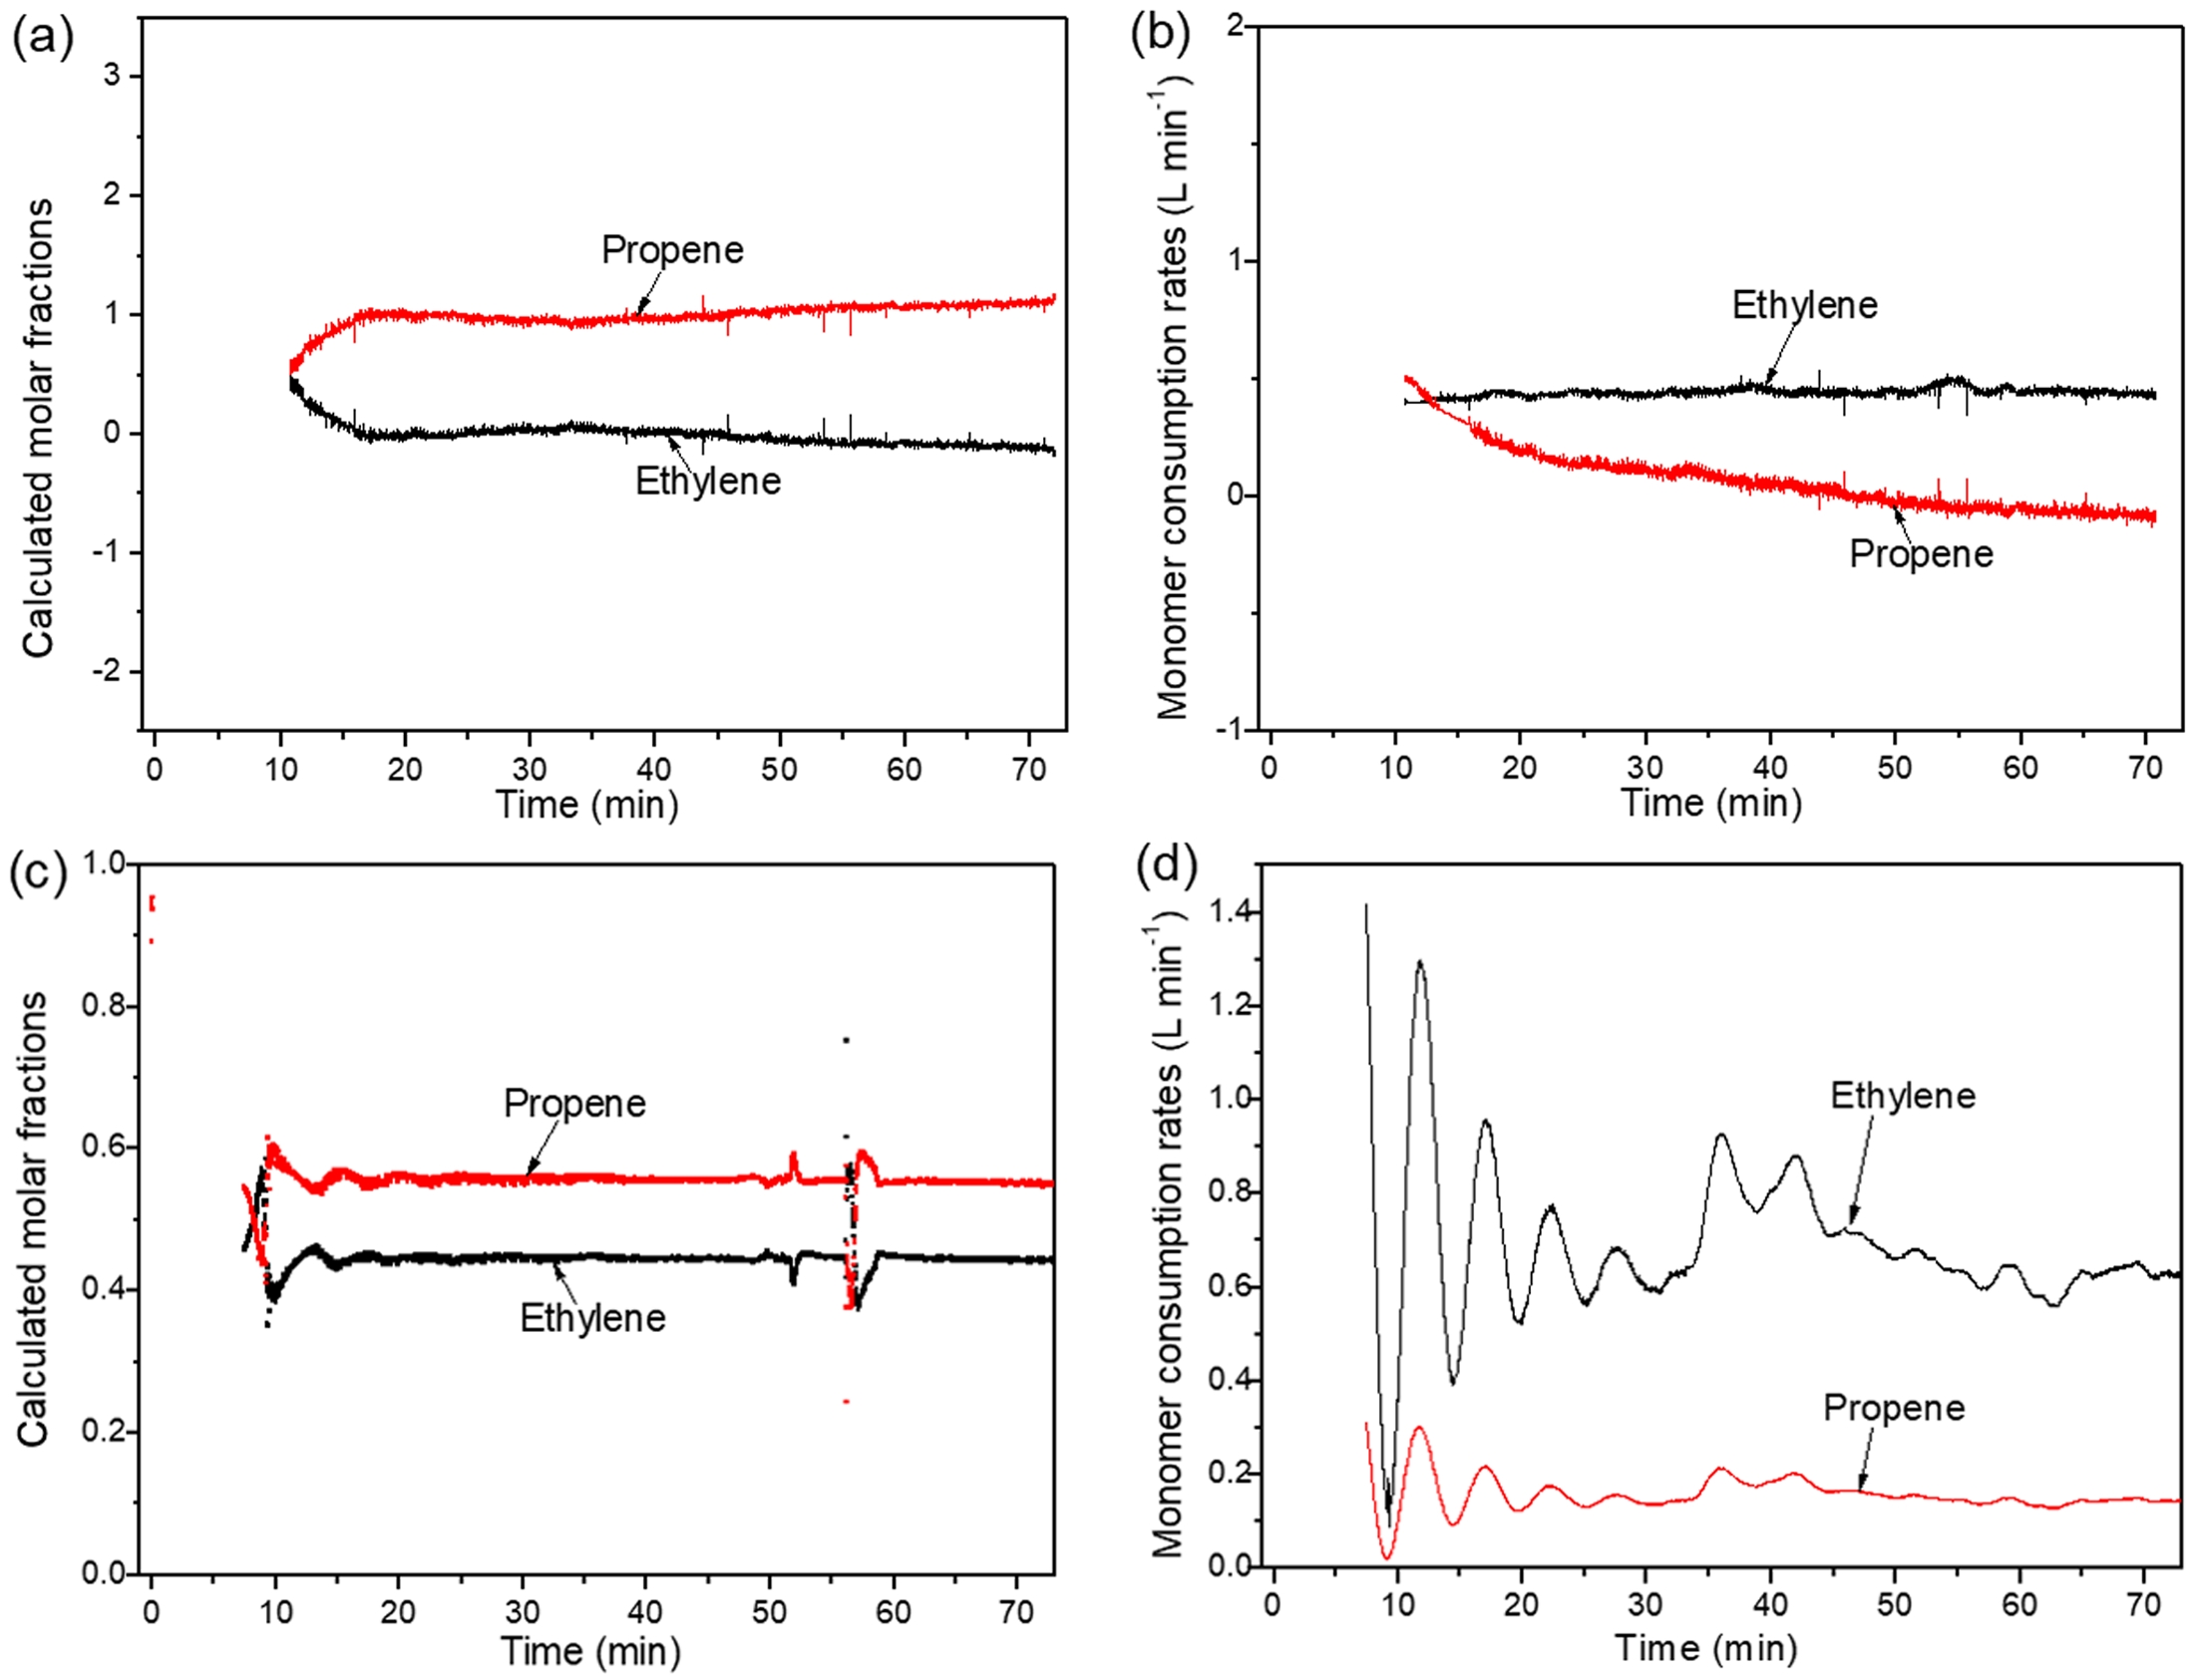
Under CAC2 (constant composition gas feeding without hydrogen), from the trend of the gas composition changes in the reactor (Figure 2(c)), the control system maintains a relatively stable gas composition. Figure 2(d) shows similar attenuation trends of ethylene and propylene consumption rates in CAC2. As shown in Figure 3, the ratio of ethylene to propylene consumption rates remains nearly constant during polymerization.
Since the slurry homopolymerization conditions for all two-stage polymerization experiments match those of run 1 (propylene slurry homopolymerization) in previous work, the slurry homopolymerization results are considered the same, with a polymerization yield of 14.3 g. This allows for the calculation of the second-stage gas-phase polymerization yield and copolymer composition, as shown in Table 2. Table 2 compares the propylene insertion in the gas-phase product calculated from each polymerization stage’s yield and alloy composition (determined by 13C NMR spectra) with that calculated from the gas-phase monomer consumption rate curves. The small difference validates the reliability of the composition detection and control systems, as well as the instant monomer consumption rate calculation based on mass balance.
From Table 2, the constant composition gas feeding mode has lower average polymerization activity than the constant ratio mode, with lower ethylene and higher propylene average polymerization rates, leading to higher propylene insertion in the copolymer. In the gas phase without hydrogen, both ethylene and propylene have lower average polymerization rates, causing lower average polymerization activity and propylene monomer insertion.
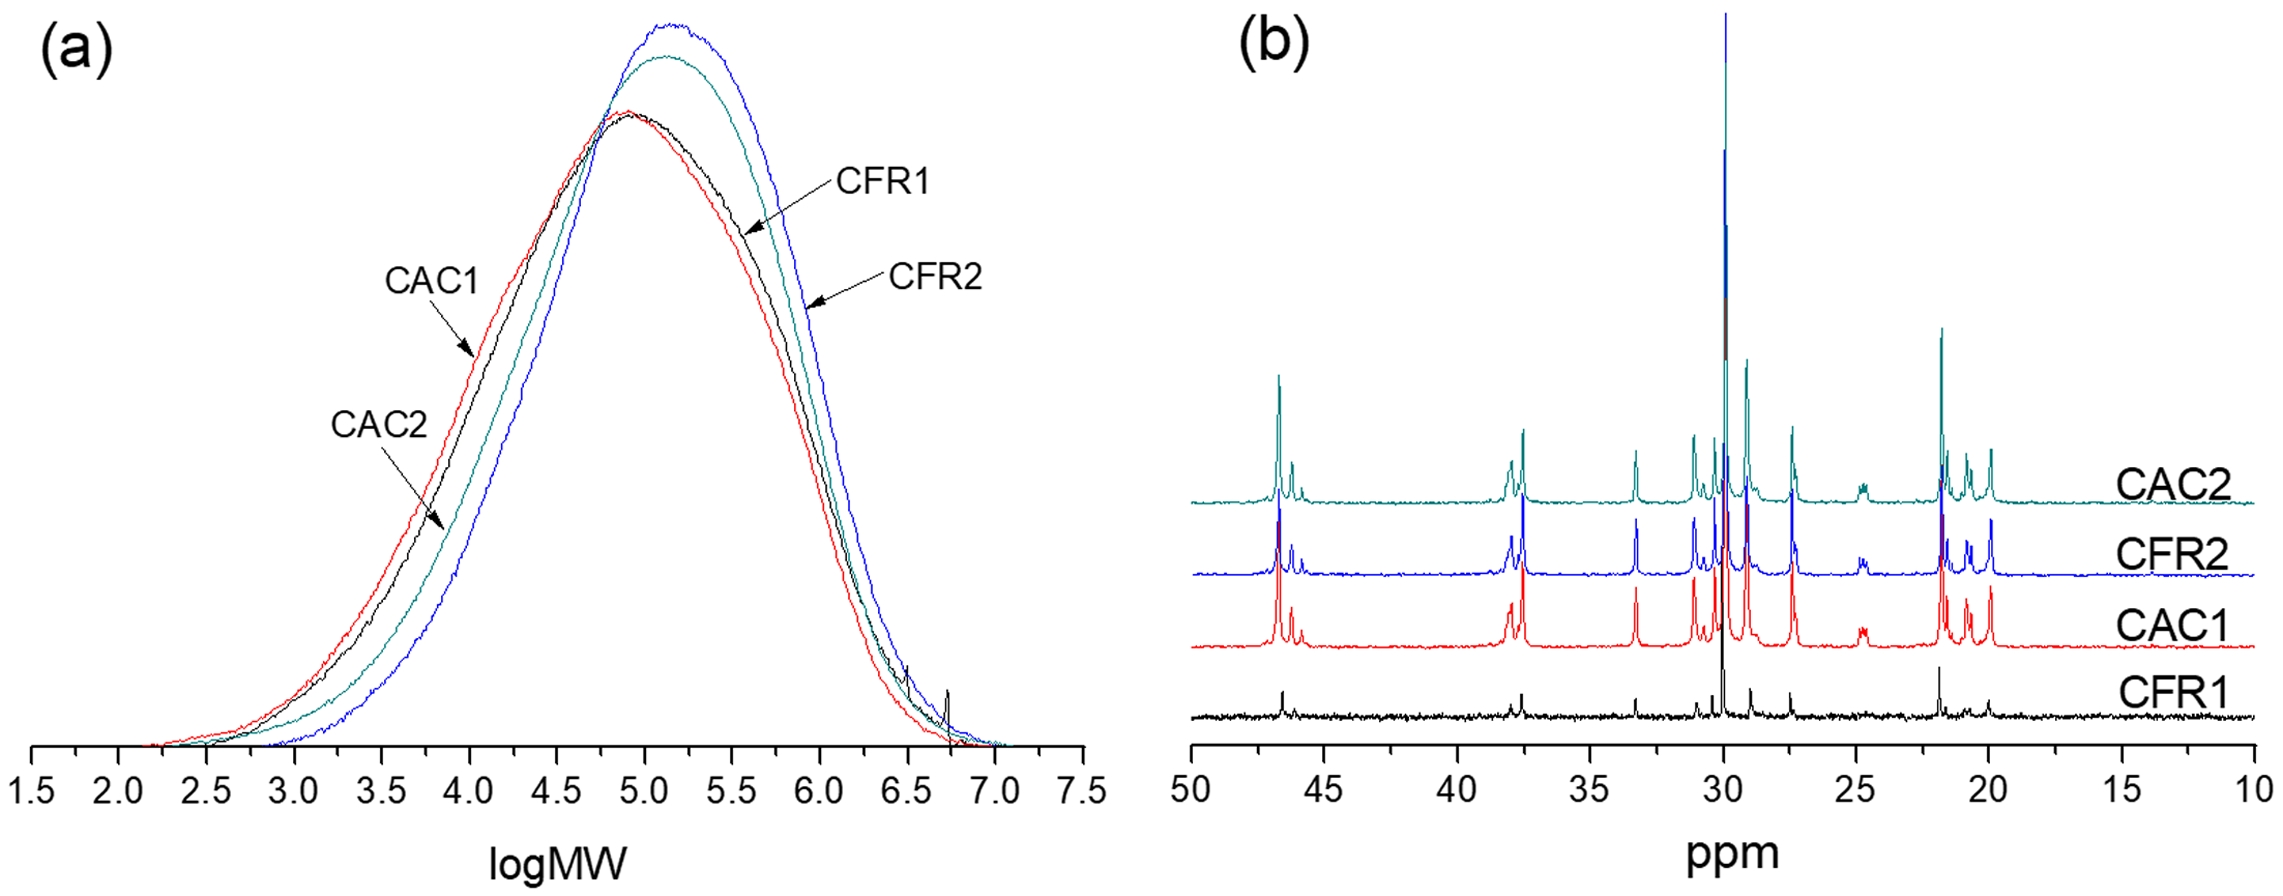
Chain Structure Analysis. The molecular weight distribution curve of the alloy product is shown in Figure 4(a). It can be seen that when hydrogen is present in the gas phase, compared to when it is absent, the polymer has a lower molecular weight and a broader distribution. Compared to the constant composition gas feeding mode, the constant ratio mode results in a higher molecular weight and narrower distribution. Since the prepared PP/P(E-co-P) is a mixture of the first-stage propylene homopolymer and the second-stage ethylene/propylene copolymer, its molecular weight distribution is a combination of those from the two polymerization stages. To clearly understand the molecular weight distribution of the second-stage product, a deconvolution analysis of the molecular weight distribution is needed here.
The molecular weight distribution of the polymer prepared by two-stage polymerization is a weighted superposition of the molecular weight distributions of the two polymerization stages with the mass fractions as weighting factors:

where, MWD represents the alloy’s molecular weight distribution. m1 is the mass fraction of the first-stage polypropylene in the alloy, with MWD1 as its molecular weight distribution. m2 is the mass fraction of the second-stage ethylene/propylene copolymer in the alloy, and MWD2 is its molecular weight distribution. Molecular weight distribution functions (MWD, MWD1 and MWD2) typically describe how dw/d(log MW) varies with log MW, which is what GPC outputs. As all slurry polymerization conditions for the first stage are the same as those for propylene slurry polymerization in previous work, MWD1 is considered identical to the molecular weight distribution of the propylene slurry polymerization product in previous work. Given the polymer molecular weight distribution weighted superposition formula (Equation 1) and knowing MWD1, we can fit the alloy’s molecular weight distribution (MWD) to determine MWD2.
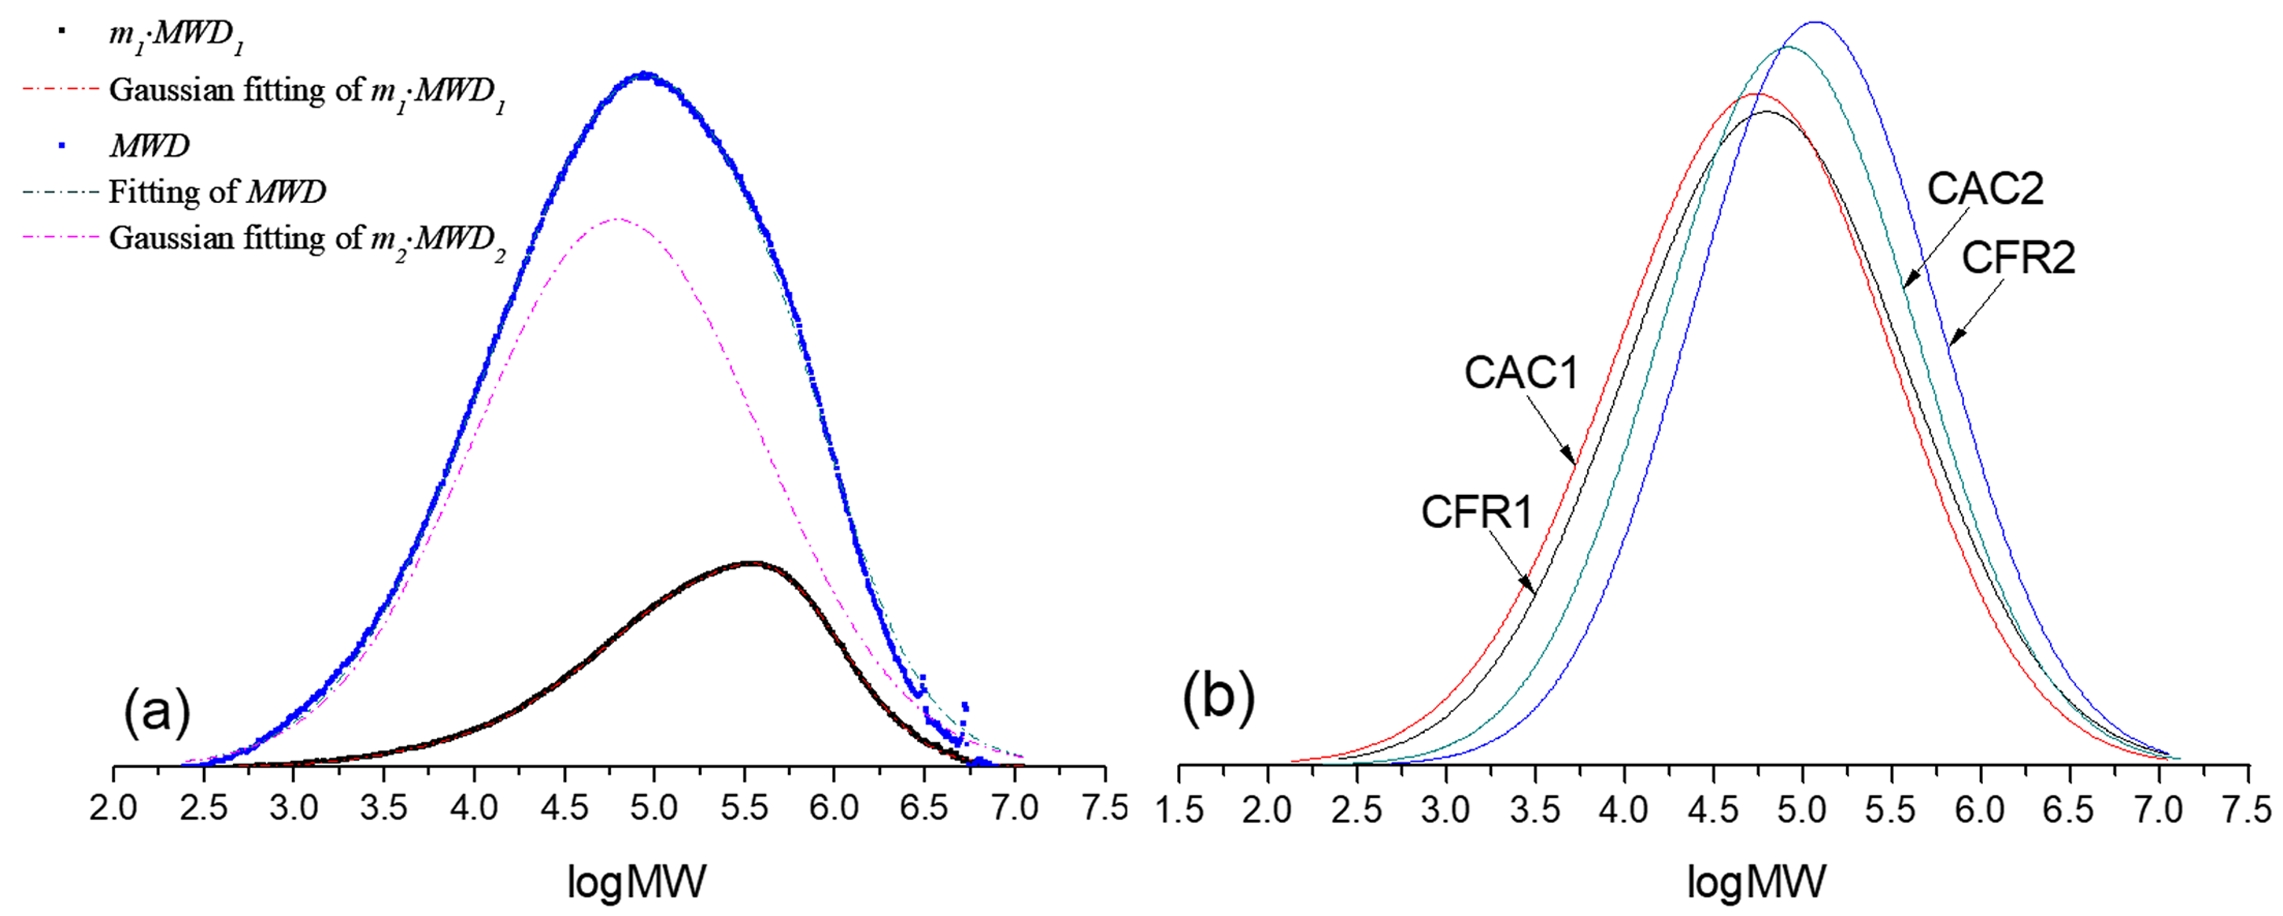
Since Gaussian distribution is often used to model polymer molecular weight distribution curves, it’s applied here for MWD1 and MWD2. Firstly, the MATLAB R2014a Curve Fitting app is used to fit MWD1 via the least squares method. Then, using the superposition formula to fit MWD allows us to find the unknown coefficients in the Gaussian function for MWD2, thereby determining MWD2. Figure 5(a) shows the molecular weight distribution decoupling process (using CAC1 as an example), and Figure 5(b) presents the decoupled second-stage product molecular weight distribution. From this, the average molecular weight and dispersity index are calculated (see Table 3). When hydrogen is present in the gas phase stage, the second-stage product has a lower molecular weight and a broader distribution. Compared to constant composition gas feeding, constant ratio gas feeding results in a higher molecular weight and narrower distribution.
The copolymer composition and sequence distribution were determined from the alloy’s 13C NMR spectrum (Figure 4(b)) and presented in Table 4. The sequence distribution of the alloy is a combination of that from the first-stage polypropylene and the second-stage ethylene/propylene copolymer. To gain insight into the sequence distribution of the second-stage product, decoupling analysis of the sequence distribution is necessary.
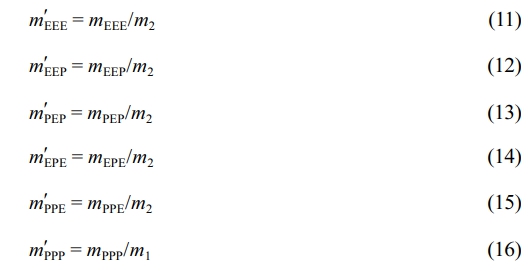
The triad sequence distribution in Table 4 is given in molar fraction. To convert the triad sequence structure molar fraction to mass fraction, the following equation is used.14
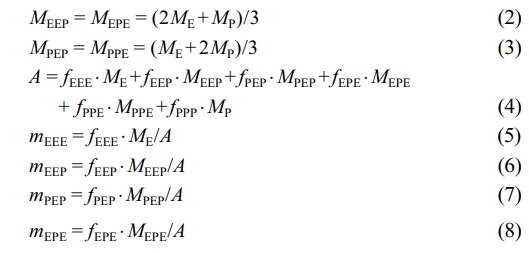
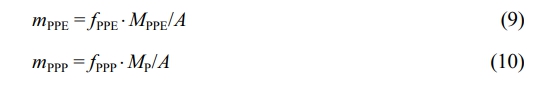
Herein, ME and MP denote the molecular weights of ethylene and propylene, MEEP , MPEP , MEPE and MPPE represent the molecular weights of the corresponding sequence structures. fEEE, fEEP , fPEP , fPPE, fEPE and fPPP are the mole fractions of the respective sequence structures. mEEE, mEEP, mPEP, mPPE, mEPE and mPPP indicate the mass fractions of the corresponding sequence structures. Moreover, after subtracting the triad sequence distribution of polypropylene (PPP) from the first stage, the mass fractions of the sequence structures in the second-stage product can be calculated:
Among them, m'EEE, m'EEP,m'PEP, m'PPE, m'EPE and m'PPP are the mass fractions of the corresponding sequence structures in the second-stage product after removing the polypropylene PPP from the first stage. m1and m2are the mass fractions of the first-stage polypropylene and the second-stage product in the overall PP/P(E-co-P). Finally, the mass fractions of the sequence structures are converted to mole fractions using the following equation:
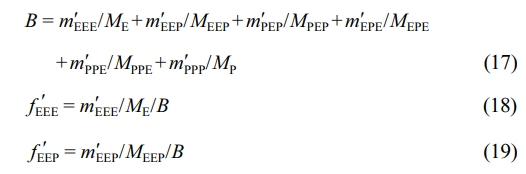
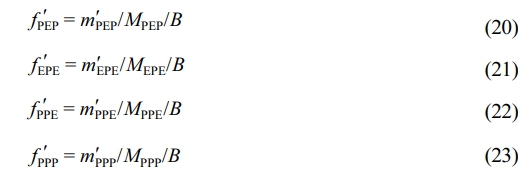
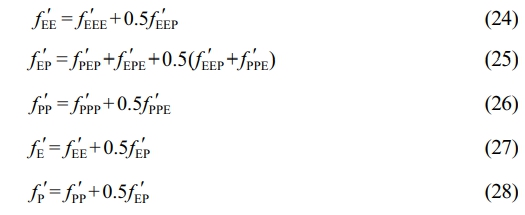
Here, f'EEE, f'EEP, f'PEP, f'PPE, f'EPE and f'PPP are the mole fractions of the corresponding sequence structures in the second-stage product after excluding the polypropylene PPP from the first stage. Then, the mole fractions of the binary and unary sequence structures can be determined as follows:
After removing the impact of first-stage polypropylene, the sequence distribution of the second-stage product is shown in Table 5. In Table 5, the content of the PPP triad sequence is greatly reduced, nearly zero, and the content of the PP binary sequence is also very low, being higher under constant composition gas feeding than under constant ratio gas feeding. The content of the EEE triad sequence exceeds 55%, with the average ethylene sequence length ranging from 5.7 to 6.12 and the average propylene sequence length around 1.5.
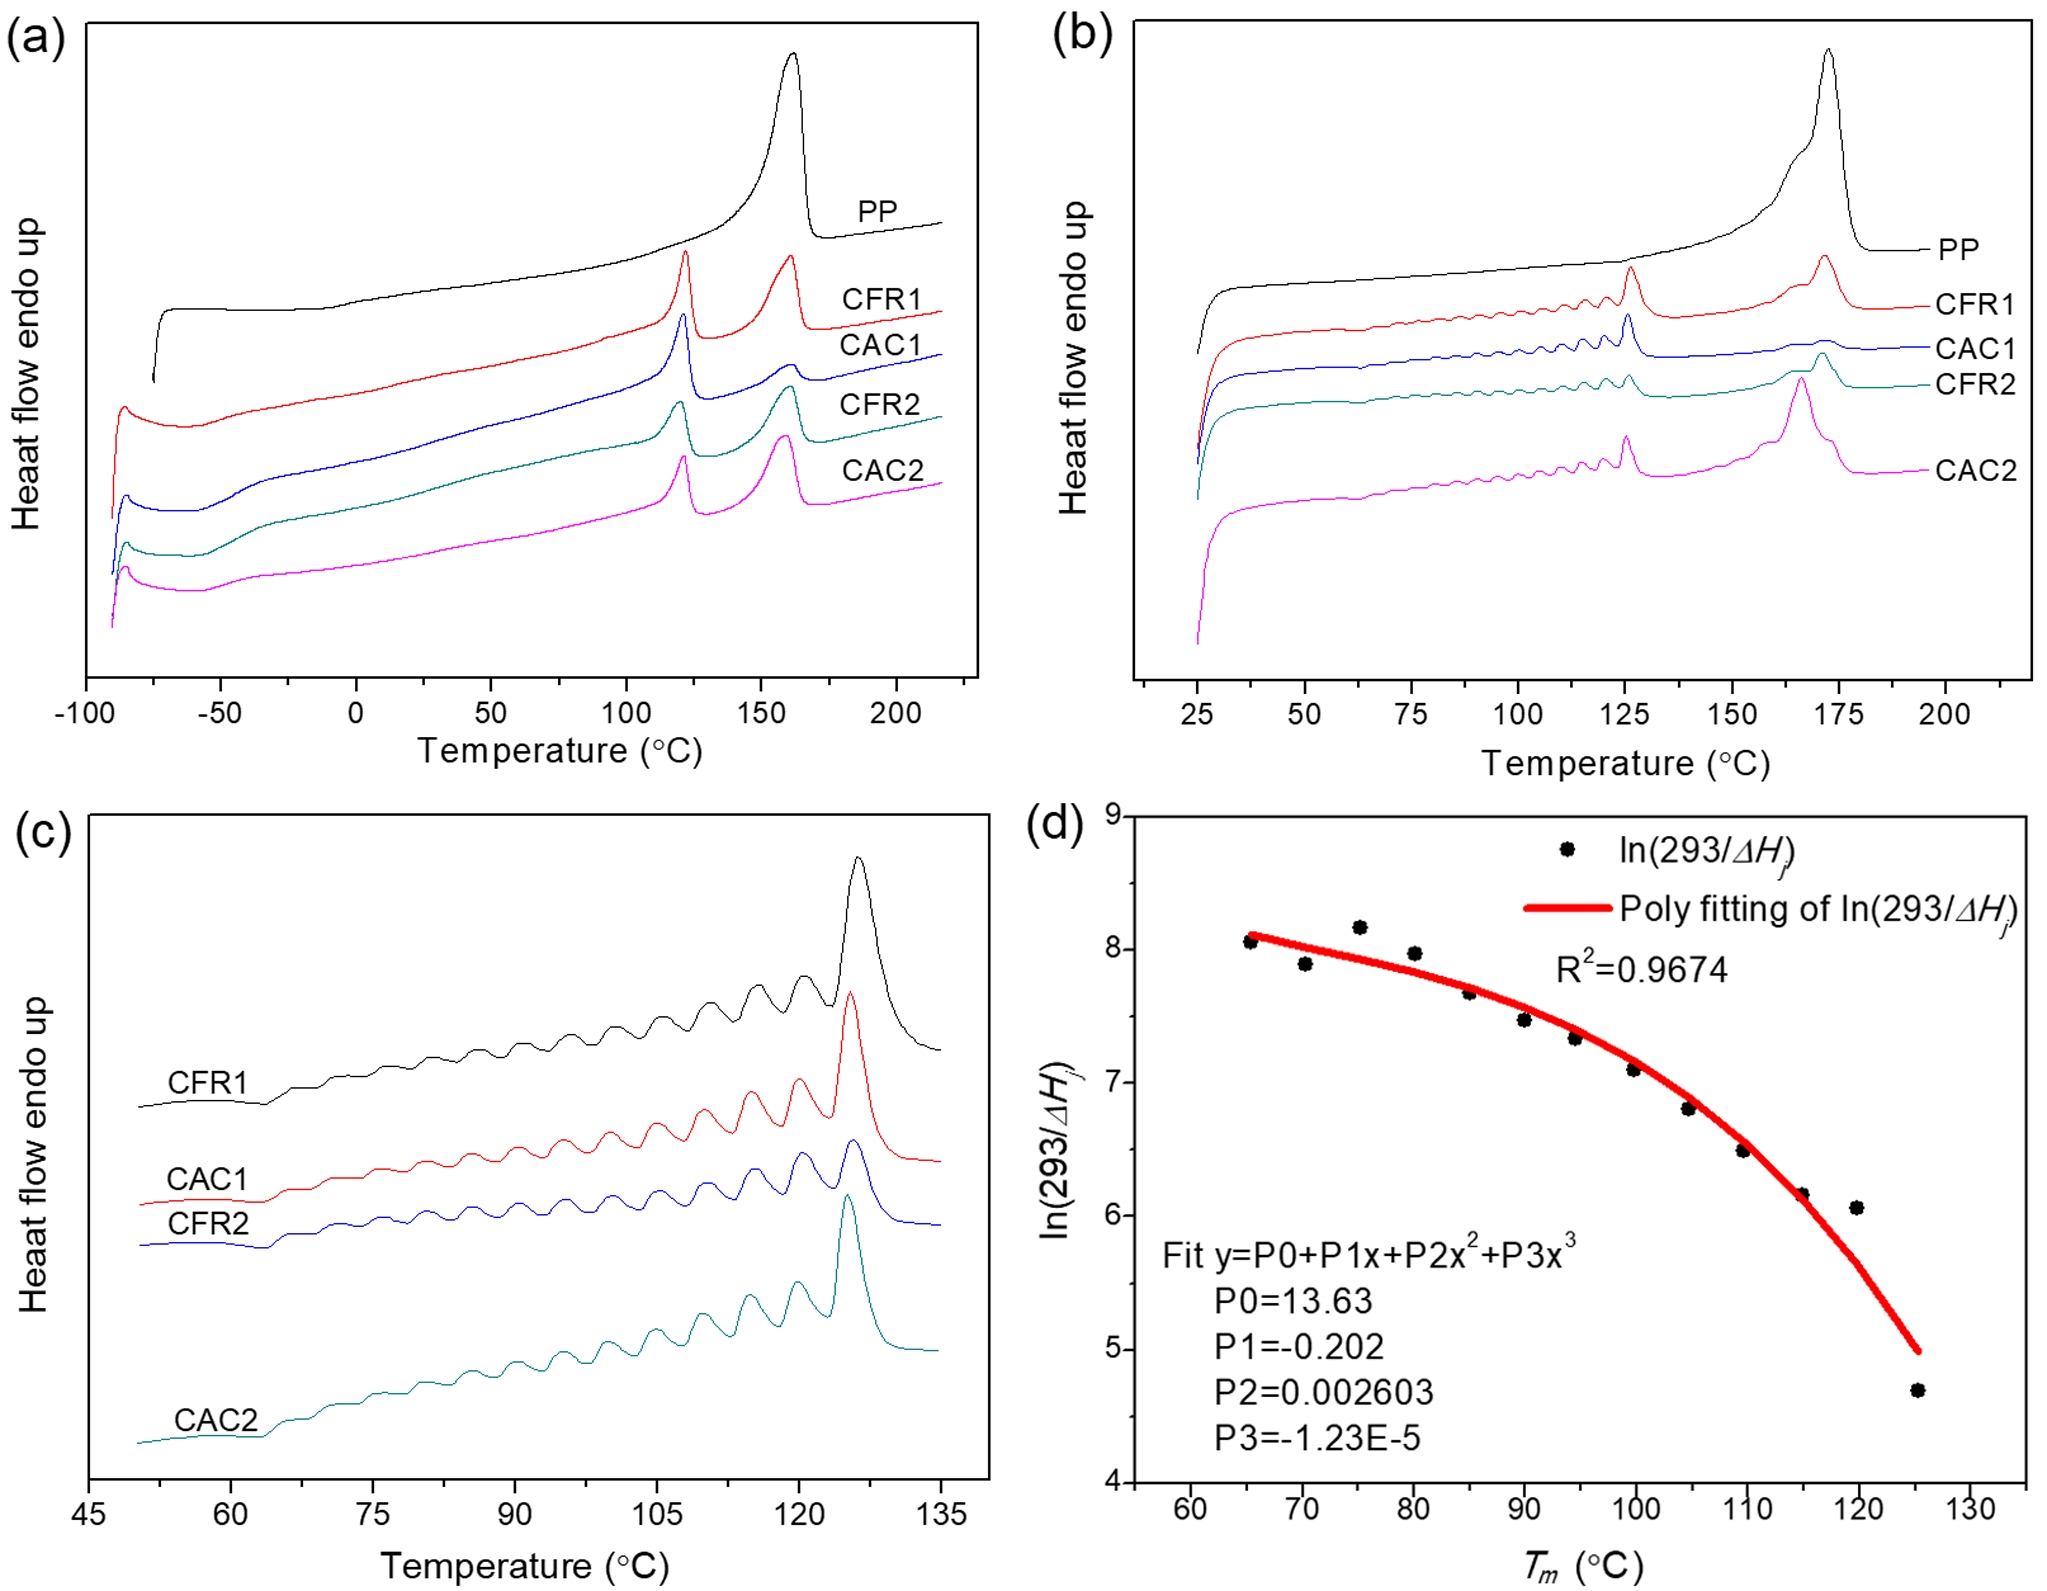
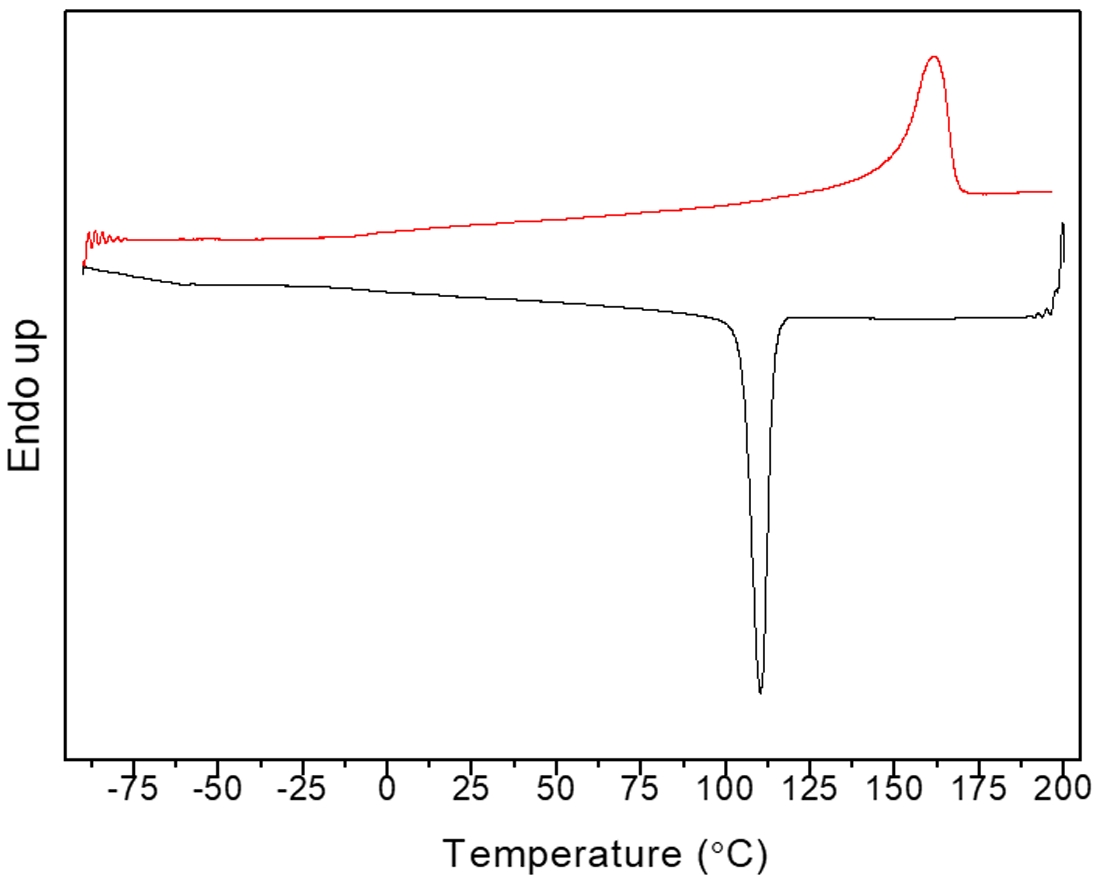
Thermal Properties Analysis. The DSC melting curves of the alloy samples, along with those after SSA treatment, are shown in Figure 6. The DSC melting curve exhibits a bimodal pattern (Figure 6(a)). As per the previous decoupling analysis of the sequence distribution (Table 5), the second-stage product has minimal PPP and PP content, with EEE and EE content exceeding half. The melting peak at around 120 ℃ is attributed to the long ethylene segments, which is supported by the average ethylene and propylene sequence lengths. The melting peak at around 160 ℃ originates from the first-stage polypropylene. Compared to polypropylene, the alloy has a much lower melting enthalpy and a glass transition temperature below -40 ℃, indicating the second stage produces components with lower melting enthalpy than polypropylene and generates ethylene/propylene random copolymer components.
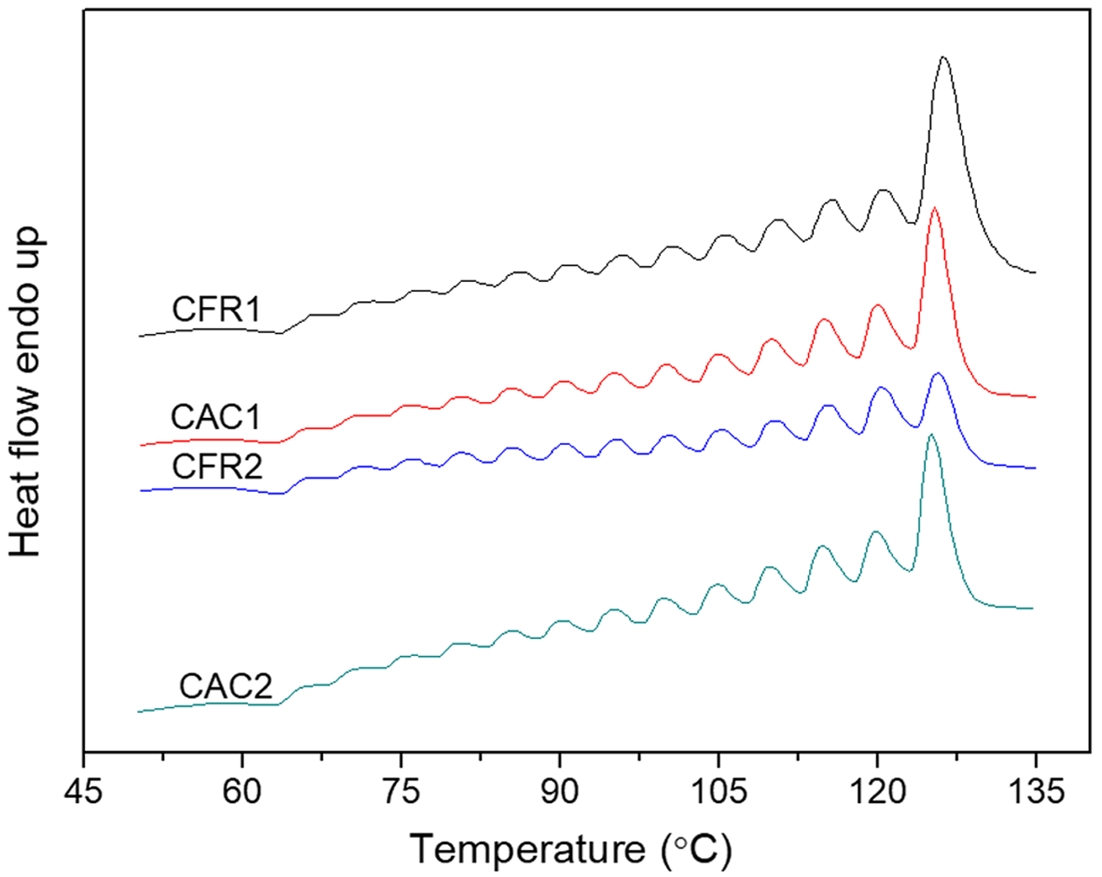
After SSA treatment, the DSC melting peaks can be further analyzed. As shown in Figure 6(b), the polypropylene melting peak splits into a small shoulder on the left and a main peak on the right. The right peak (melting peak near 160 ℃) of PP/P(E-co-P) almost replicates the SSA fractionation curve of polypropylene, indicating it represents the first-stage polypropylene. The left peak of PP/P(E-co-P), not seen in polypropylene, covers a series of melting peaks between 60 and 135 ℃ (Figure 6(c)), which belong to the ethylene/propylene copolymer from the second stage, arising from the ethylene segments.
The SSA fractionation technique involves thermal treatment of polymers via DSC to form crystals of varying sizes. Differences in crystal size and mass content lead to variations in melting peak temperatures and intensities after fractionation. Each fraction corresponds to a set of crystallizable segments, so the distribution of melting peaks in the SSA fractionation curve (peak position, number, and intensity) effectively reflects the distribution of crystallizable segments in the polymer chain. This is a comprehensive reflection of the composition distribution within and between polymer chains.15 Here, the differences in composition distribution within and between chains of ethylene/propylene copolymers under constant ratio and constant composition gas feeding modes are revealed by calculating the crystal size distribution and the distribution of crystallizable methylene sequence lengths. Each fraction in the SSA fractionation curve corresponds to a set of crystallizable segments. The crystal thickness (lamellae thickness) and crystalline methylene sequence length (CMSL) for each fraction can be determined from the melting point of that fraction:16,17
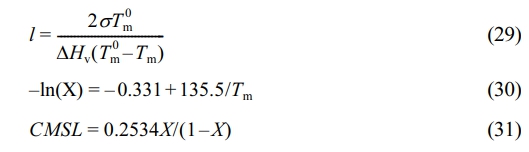
Here, l denotes the crystal thickness (in nm). s is the side-surface free energy of an infinite polyethylene lamella (0.09 J·m-2). Tm0 is the equilibrium melting point of a polyethylene lamella (418.5 K). DHv is the melting enthalpy of an infinite polyethylene lamella (2.93×10⁸ J·m-3). Tm represents the melting peak temperature of each fraction in the SSA fractionation curve. X is the molar fraction of methylene groups. CMSL is the crystalline methylene sequence length (in nm).
Using the same calculation principle as for determining the average molecular weight (Mw and Mn) and the polydispersity index (PDI = Mw/Mn) of polymers, the distributions of crystal thickness and CMSL are calculated:
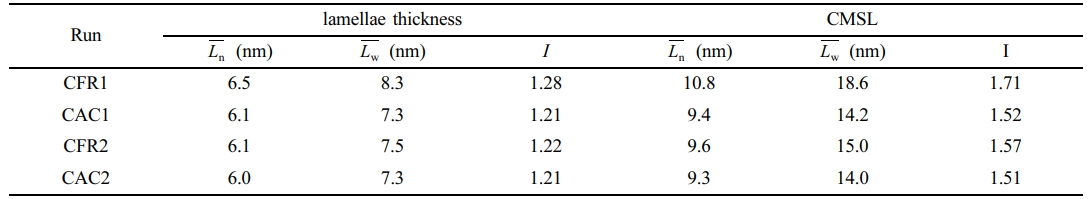
Here, Lj denotes the crystal thickness (lamellae thickness) or crystalline methylene sequence length (CMSL) corresponding to fraction j, and nj is the normalized mass fraction of fraction j. The melting enthalpy fractions from the SSA curve can't be directly normalized as mass fractions, as the melting enthalpy of a crystal is temperature-dependent. Lower melting temperatures lead to lower melting enthalpies, so the melting enthalpy fraction doesn’t reflect the true mass fraction.18 To correct this, the ratio of the melting enthalpy of a perfect crystal (293 J·g-1) to the actual melting enthalpy of each fraction (ΔHj) is used as a correction factor.19 Figure 6(d) shows the fitting relationship of the correction factor (293/ΔHj) versus temperature (data from CFR2). The mass fraction of each fraction is obtained by multiplying its melting enthalpy fraction by the correction factor and then normalizing. The average crystal thickness, CMSL, and their dispersity indices, calculated in this way, are listed in Table 6.
As per Table 6, under the constant ratio gas feeding mode, the ethylene/propylene copolymer in the gas phase has a broader distribution of crystal thickness and crystalline methylene sequence length compared to the constant composition mode. The SSA curve reflects the lamellar distribution within the polymer, which is influenced by the composition distribution within and between polymer chains. Under the constant ratio mode, the reactor gas composition gradually deviates from the feed composition, while under the constant composition mode, the reactor gas composition remains stable, reducing copolymer composition drift and leading to a more uniform lamellar distribution. This indicates a more homogeneous composition distribution within and between copolymer chains. However, due to the multi-active-site nature of the Ziegler-Natta catalyst system, the copolymer composition distribution is relatively broad, resulting in a wide lamellar distribution. When compared to polymers prepared with single-active-site catalyst systems (with dispersity indices between 1 and 1.1 as reported in reference [9]), the dispersity indices here are still relatively large.
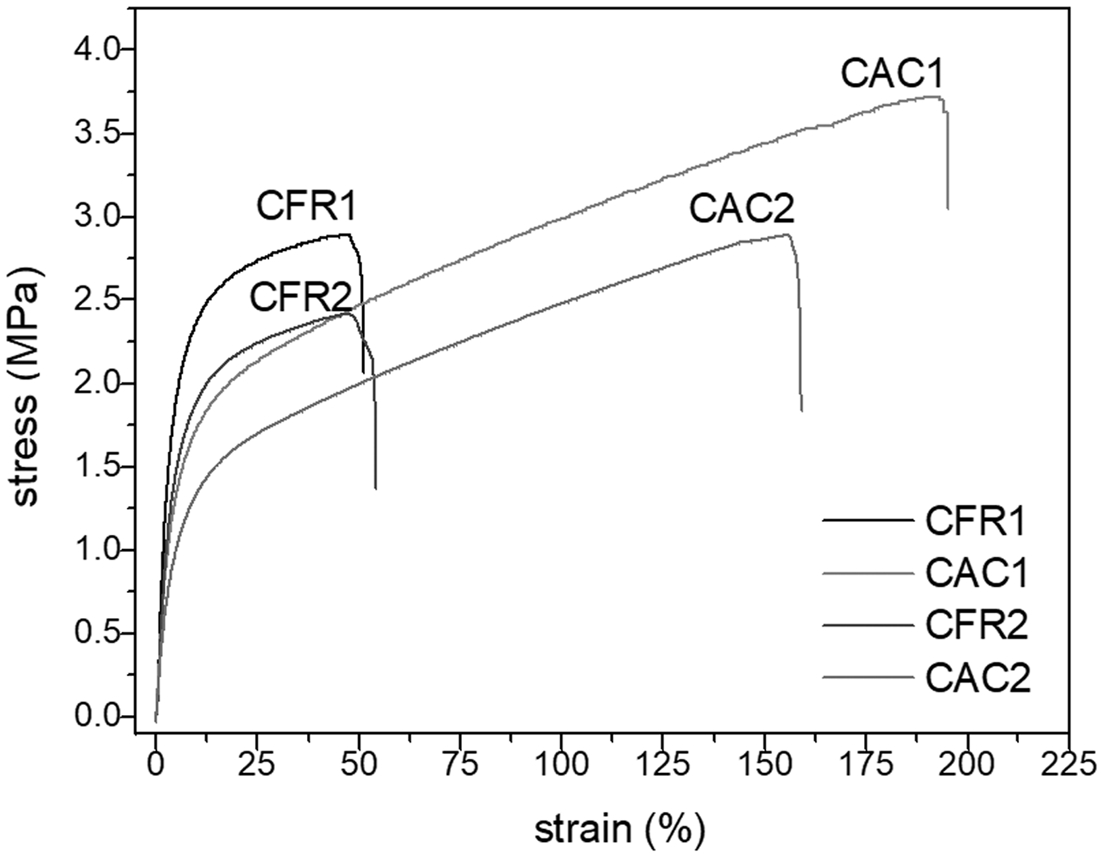
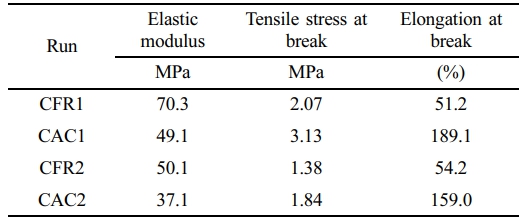
Mechanical Property Testing. The prepared alloy samples were tested for low-temperature (-50 ℃) impact properties, and none of the samples could be broken by impact, showing their excellent low-temperature toughness. Tensile testing at room temperature was also performed on the samples, with results presented in Table 7. It can be seen that the samples prepared under constant composition feeding mode showed higher tensile strength and elongation at break compared to those prepared under constant ratio feeding mode.
Further analysis through tensile stress-strain curves (Figure 7) allows for a clear observation of the deformation behavior of the samples during tensile testing. In the initial stage of tensile testing, the tensile stress increases linearly with strain, and the sample is uniformly elongated, demonstrating Hookean elastic behavior. Subsequently, the tensile stress continues to increase with strain at a lower rate until the sample breaks. Throughout the tensile process, no yielding inflection point is observed. The stress-strain curves suggest that the samples are soft and tough. Overall, the alloy samples are toughened plastics (the elastomer produced in the gas phase toughens polypropylene plastic).
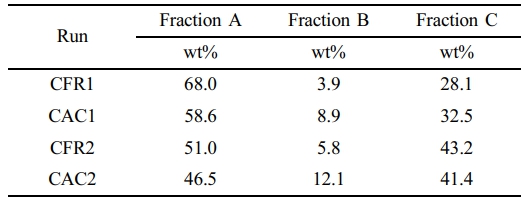
Polymer Solvent Fractionation. As in the previous work, the alloy samples were subjected to a two-step fractionation process, with the results presented in Table 8.
As shown in Table 8, the content of Fraction A in the samples prepared in this work is around 50 wt%, higher than the EPR content in impact-resistant polypropylene used in industry (which is typically around 40 wt% at most). This places the alloy samples in the category of elastomers (with at least 40 wt% EPR content). It can be seen that the excellent low-temperature toughness of the alloy samples is related to the high content of EPR. However, due to the lower content of Fraction C (the high isotactic polypropylene component), the modulus of the samples is reduced. Compared to the constant composition feeding mode, the constant ratio feeding mode results in a higher mass fraction of Fraction A in the prepared samples (which can also be inferred from the (PEP+EPE) sequence data in Table 5). In contrast, the constant composition feeding mode yields a higher mass fraction of Fraction B. This may be because, under the constant ratio feeding mode, the average polymerization activity in the gas phase is higher, leading to a higher combined mass fraction of Fractions A and B. Since Fraction A has a much larger proportion than Fraction B, the mass fraction of Fraction A may be higher as a result. Under the constant composition feeding mode, the average polymerization activity in the gas phase is lower, resulting in a lower combined mass fraction of Fractions A and B. Since Fraction A still has a much larger proportion than Fraction B, the mass fraction of Fraction A may be lower and that of Fraction B may be higher.
Combining the tensile test data of the samples, it is found that the toughness of the samples (indicated relatively by the integral area of the stress-strain curve) is most affected by the content of Fraction B. Compared to the constant ratio feeding mode, the samples prepared under the constant composition feeding mode have a lower mass fraction of Fraction A but a higher mass fraction of Fraction B, resulting in better material toughness and higher elongation at break. References [44] and [91] reveal that Fraction B consists of ethylene/propylene block copolymers and a small amount of medium- to low-isotactic polypropylene (mi-PP). The ethylene/propylene block copolymers have crystallizable long ethylene or long propylene chains, which provide good compatibility between the ethylene/propylene random copolymer and the high isotactic polypropylene, thereby enhancing the toughness of the alloy.
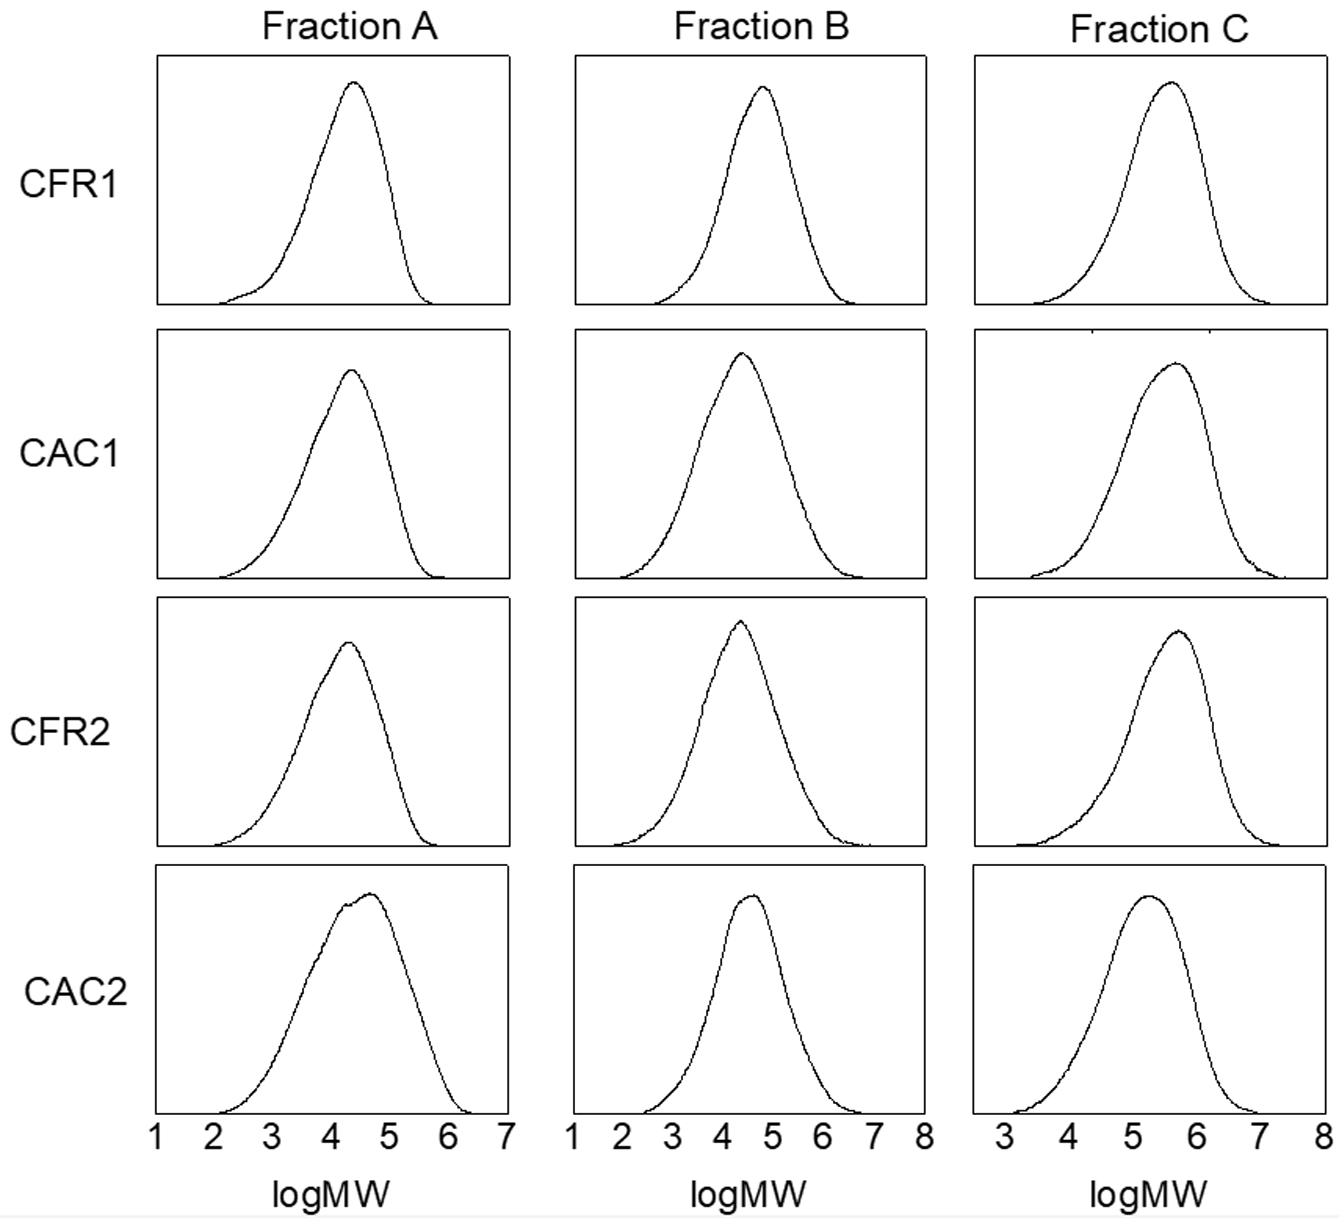
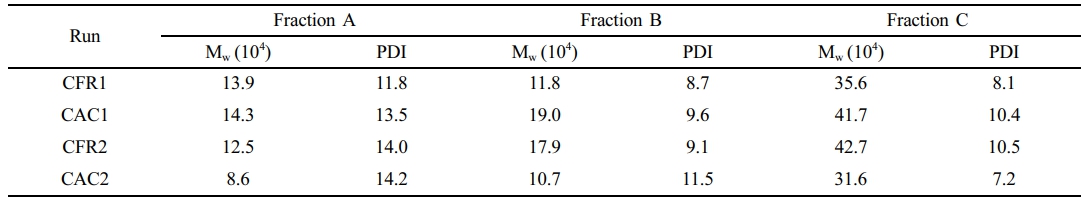
The structure and properties of each fraction of the alloy samples were also characterized. The molecular weights and their distributions of each fraction of the alloy samples are shown in Table 9 and Figure 8. The weight-average molecular weights of Fractions A and B are around 100000, while that of Fraction C is the highest, ranging from 310000 to 430000. All fractions exhibit a unimodal molecular weight distribution. As analyzed in the previous work, the unimodal molecular weight distribution of Fraction B indicates a low content of polypropylene homopolymer in the alloy and a low content of mi-PP in Fraction B.
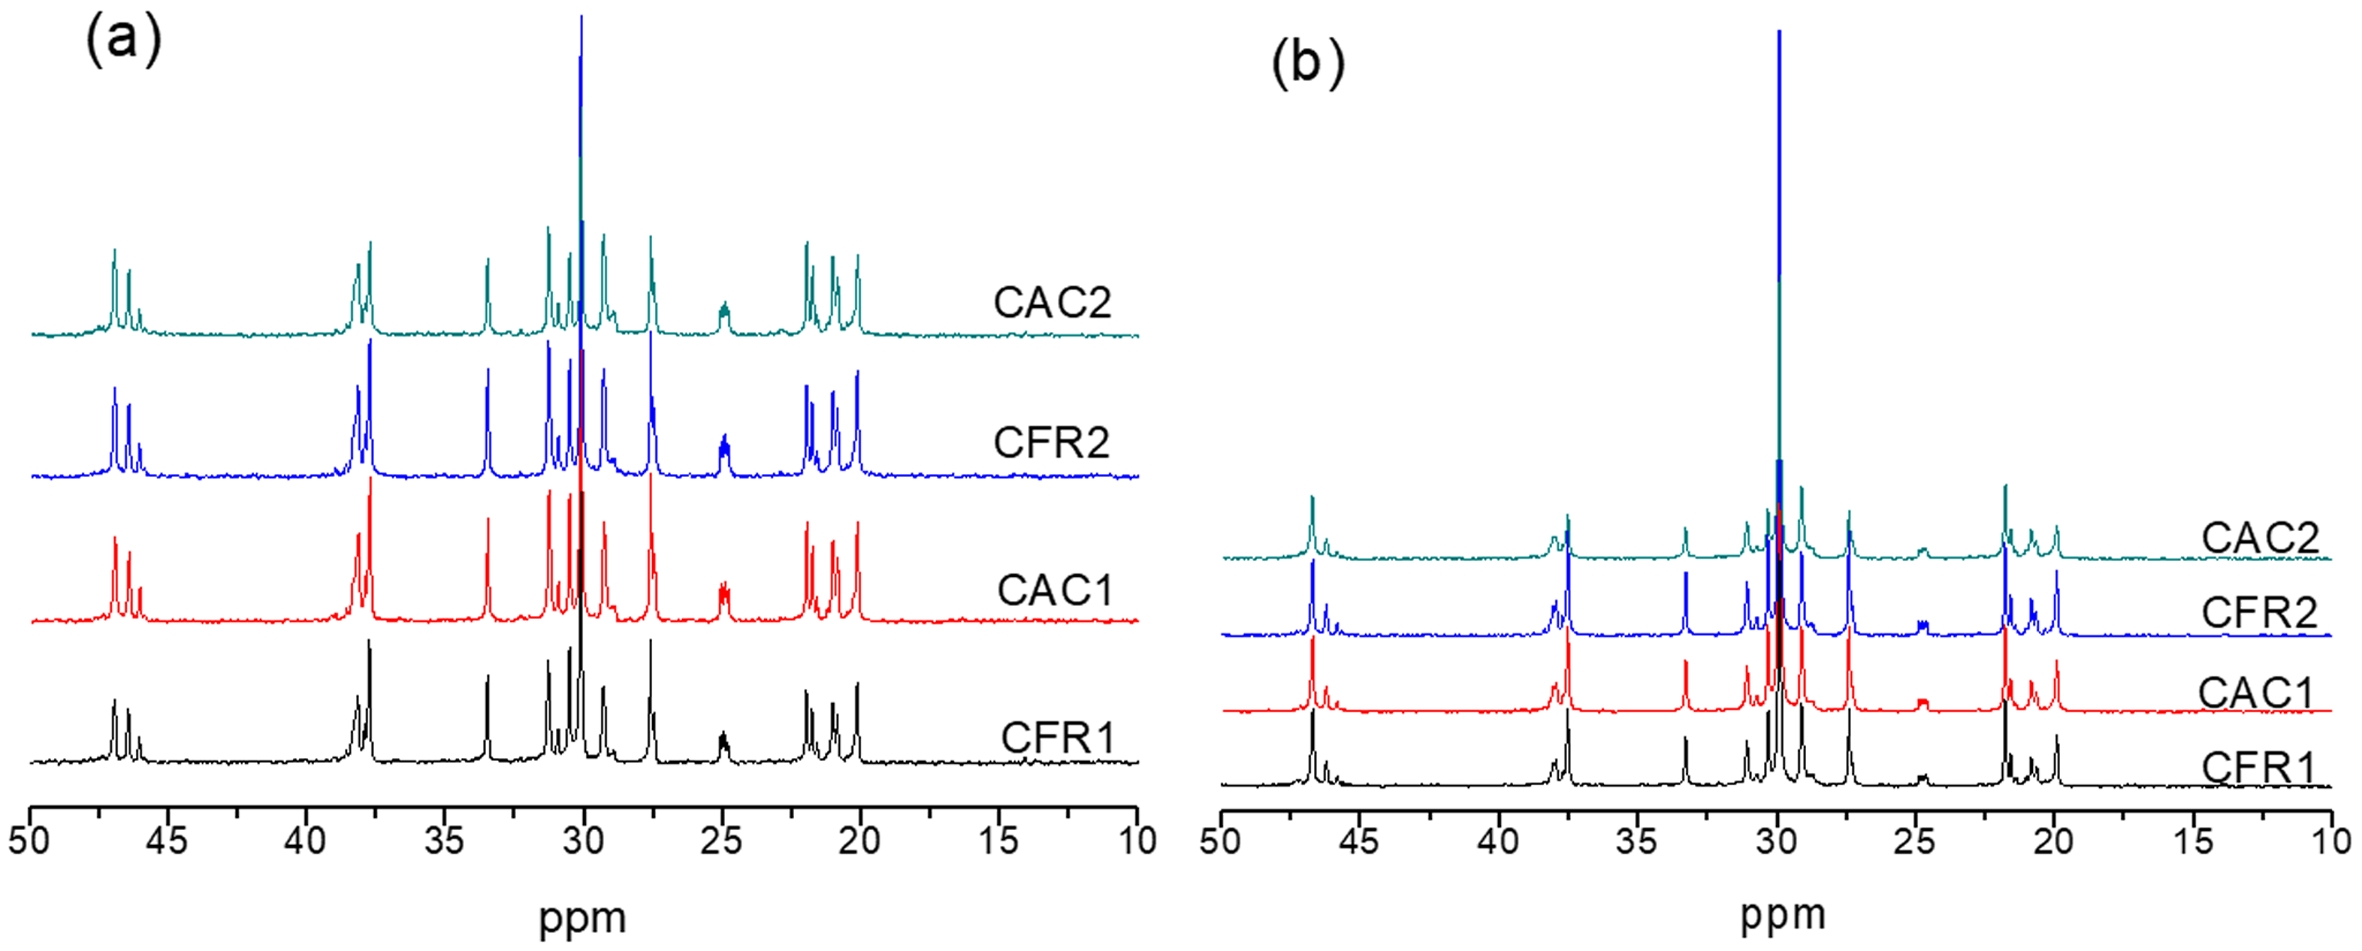
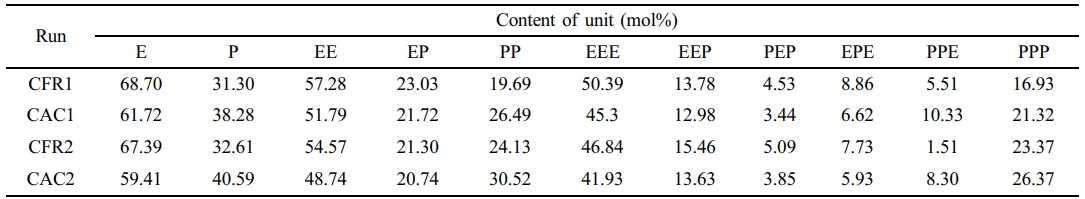
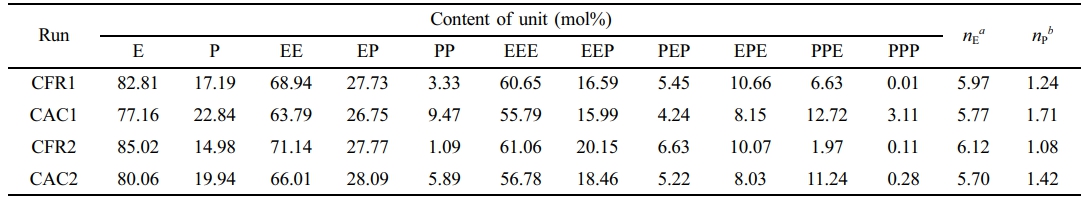
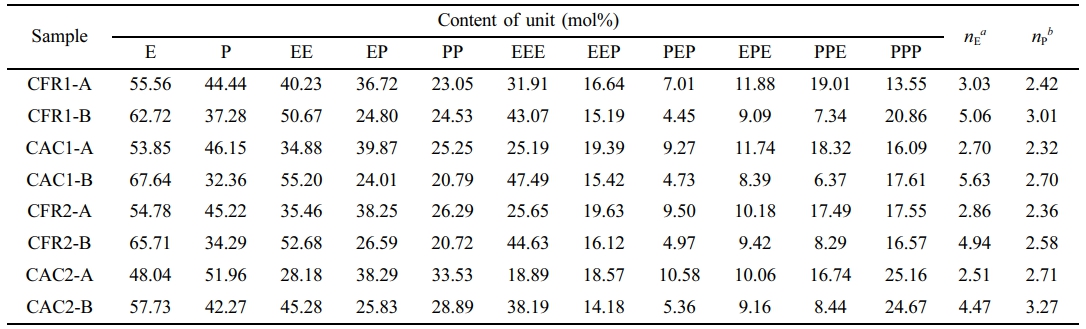
Further 13C NMR testing was conducted on Fractions A and B, with the 13C NMR spectra shown in Figure 9. The calculated sequence structure distributions are listed in Table 10.
As shown in Table 10, the propylene content in Fraction A ranges from 44% to 52%, while that in Fraction B ranges from 32% to 43%, with a higher ethylene content than propylene. The content of EP sequences in Fraction A (about 40%) is higher than that in Fraction B (about 25%). The average ethylene and propylene sequence lengths are both around 2.5. In Fraction B, the content of (EEE+PPP) sequences is higher than 61%, compared to around 40% in Fraction A. The average ethylene sequence length ranges from 4.4 to 5.7, and the average propylene sequence length ranges from 2.5 to 3.3, both of which are higher than the corresponding values in Fraction A. Combined with the DSC analysis below, it can be further demonstrated that Fraction A is an amorphous ethylene/propylene random copolymer, while Fraction B is an ethylene/propylene block copolymer containing long ethylene or long propylene sequences.
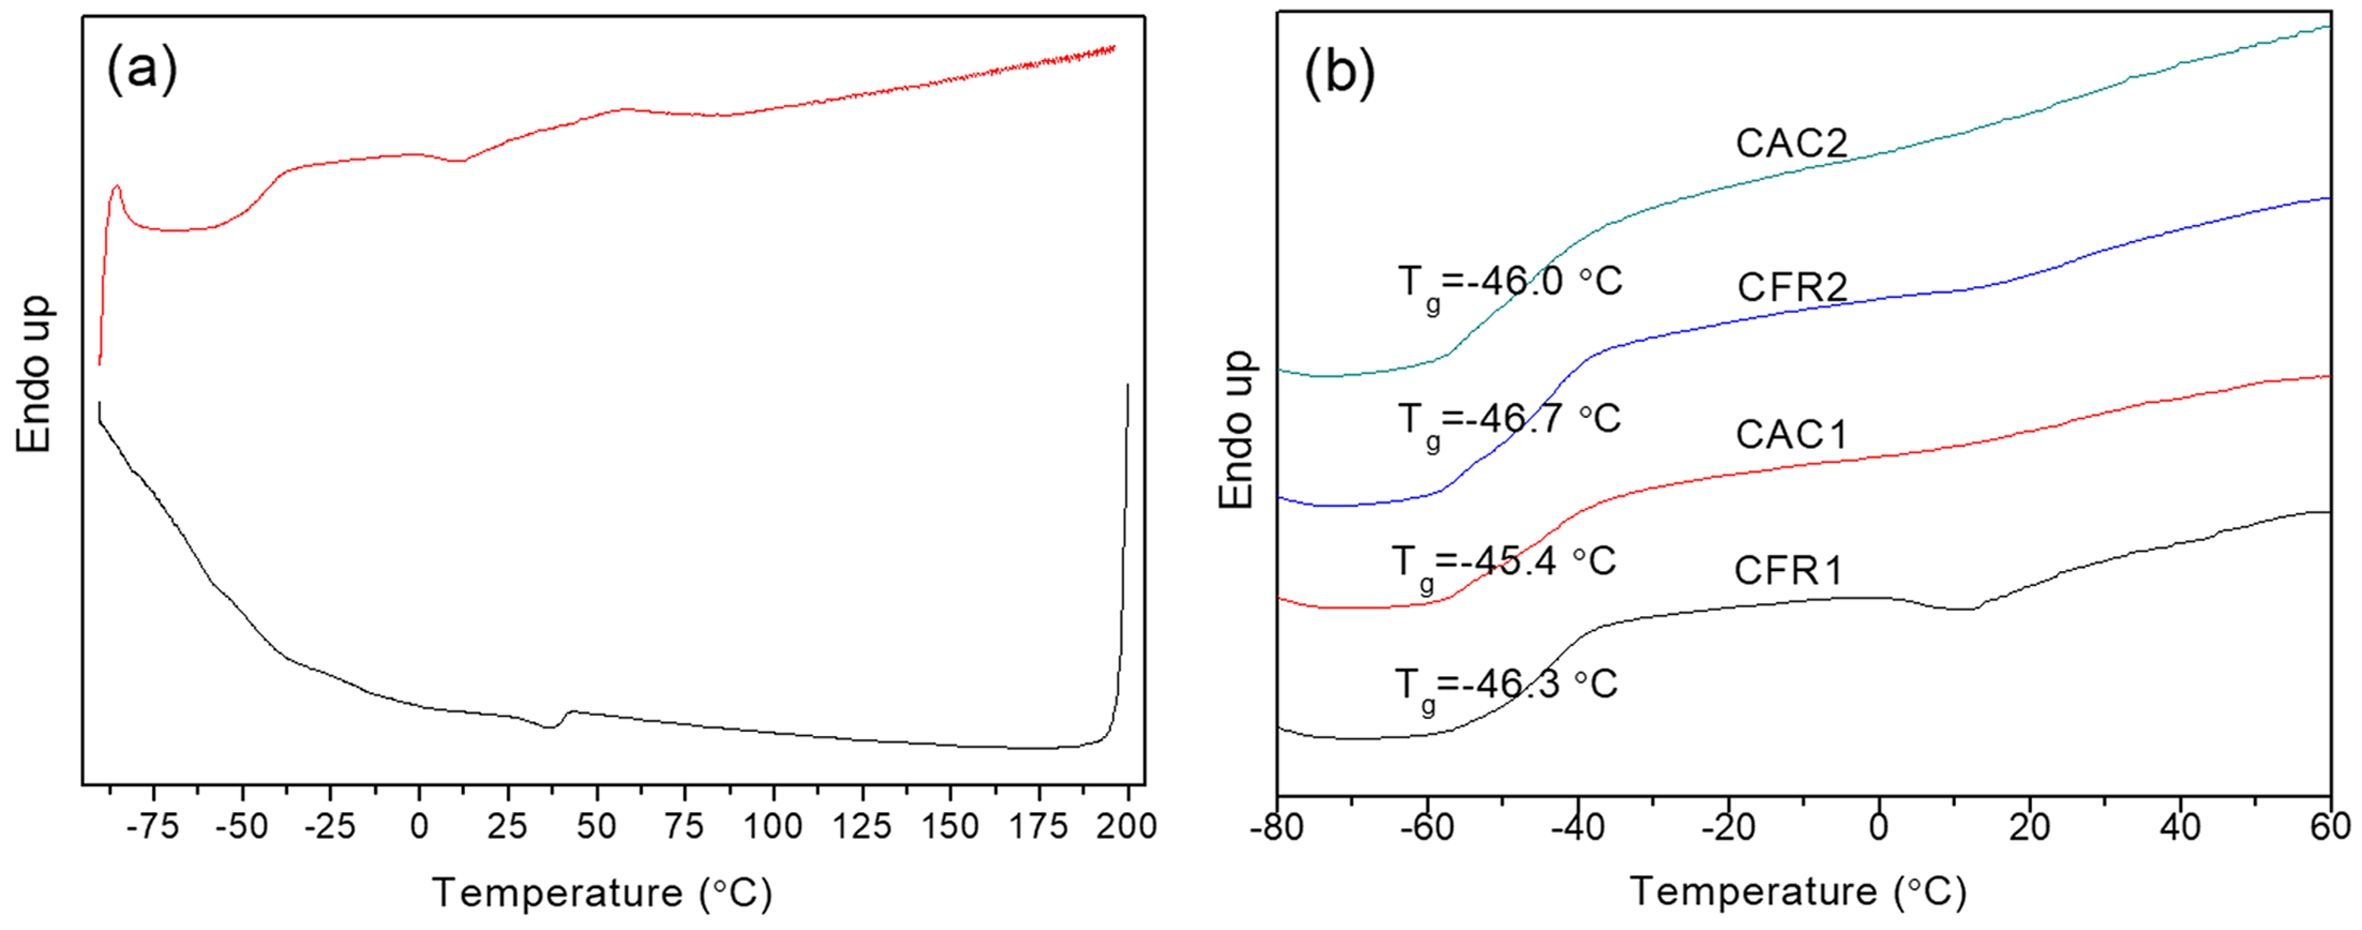
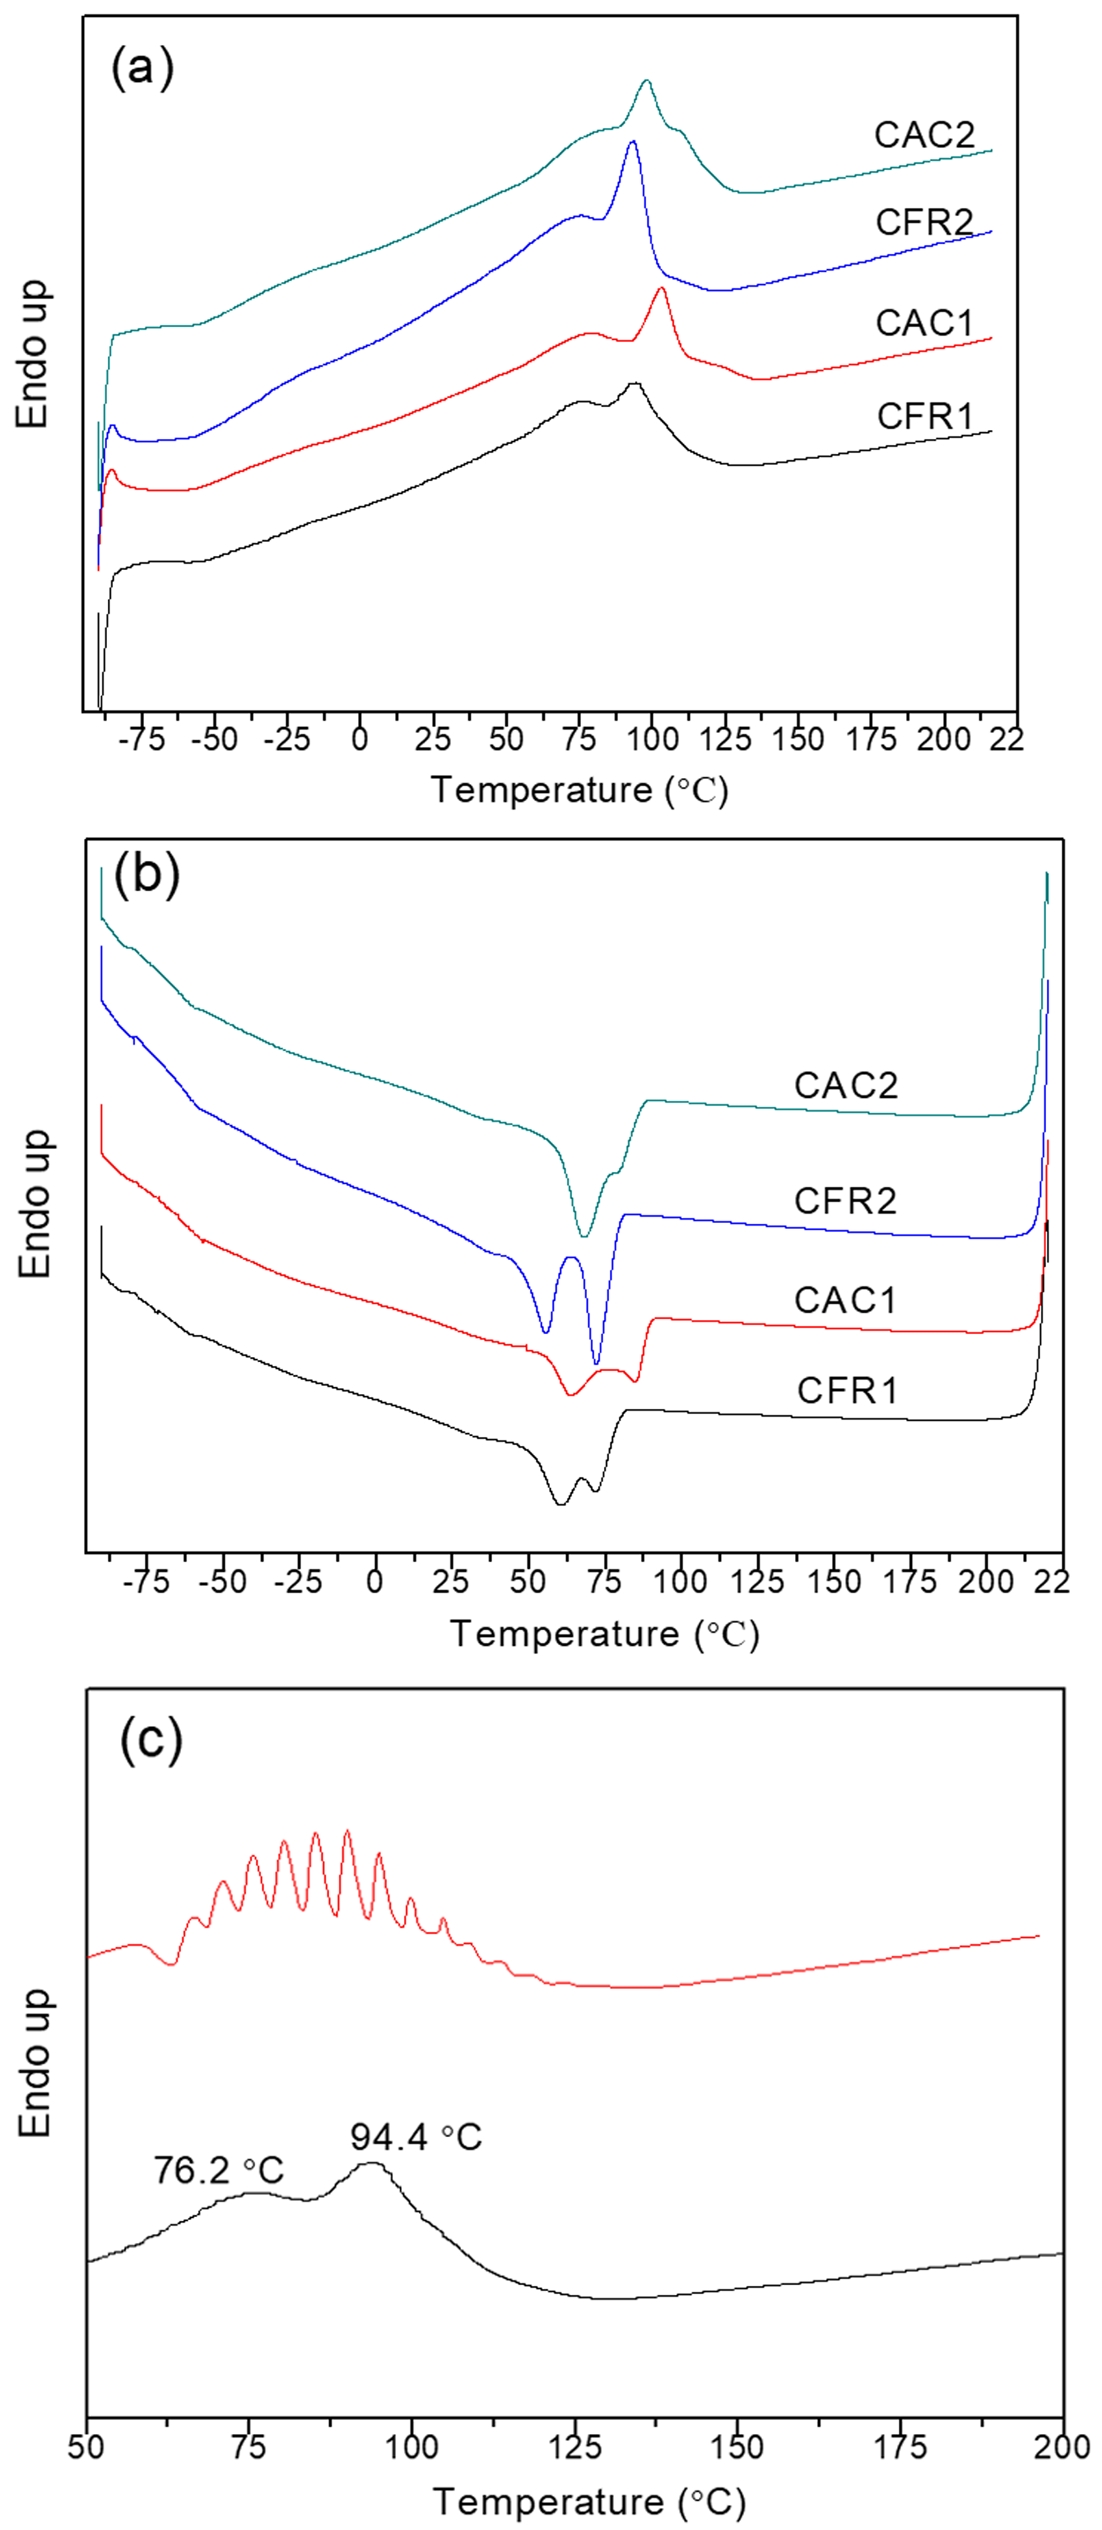
Figure 10 shows the DSC crystallization and melting curves of Fraction A in the alloy samples under CFR1. It can be seen that Fraction A has no obvious melting or crystallization peaks, but a distinct glass transition around -46 ℃ (Figure 10(b)), indicating that Fraction A is an amorphous ethylene/propylene random copolymer. Figures 11(a-b) show the DSC melting and crystallization curves of Fraction B. There are obvious melting peaks in the range of 60-135 ℃, with two to three sharp melting peaks, and two crystallization peaks between 50 and 90 ℃. Therefore, Fraction B does not contain polyethylene and polypropylene (since the melting temperatures of polyethylene and polypropylene are around 135 ℃ and 165 ℃ ℃, respectively). The melting and crystallization peaks are contributed by long ethylene or propylene chains (from ethylene/propylene block copolymers or medium-low isotactic polypropylene). When Fraction B under CFR1 was analyzed using SSA, the original melting peaks were further divided into several smaller peaks (Figure 11(c)). Since each small peak corresponds to a different length of crystallizable chain segments (long ethylene or propylene sequences), this indicates that Fraction B has a broad distribution of crystallizable chain segment lengths (sequences).
Figure 12 shows the DSC melting and crystallization curves of Fraction C under CFR1. The melting peak is at 161.3 ℃, and the crystallization peak is at 112.8 ℃, indicating that Fraction C is highly isotactic polypropylene.
|
Figure 2 Atmosphere compositions in reactor during stage II in (a) CFR2; (c) CAC2 monomer consumption rates during stage II in; (b) CFR2; (d) CAC2. |
|
Figure 3 Consumption ratio of ethylene and propene in CAC2. |
|
Figure 4 (a) GPC curves; (b) 13C NMR spectra of the polymers. |
|
Figure 5 ecoupling of MWD in CAC1 (a); decoupled MWD2 in all runs (b). |
|
Figure 6 DSC melting curves of (a) the polymers; (b) the polymers after SSA treatment; (c) SSA curves between 50 and 135℃; (d) variation of heat of fusion with melting temperature. |
|
Figure 7 Stress-strain curves. |
|
Figure 8 MWDs of each fraction of alloys. |
|
Figure 9 13C NMR spectra of (a) fractions A; (b) B. |
|
Figure 10 DSC curves of (a) fraction A in CFR1; (b) glass transition of fraction A. |
|
Figure 11 (a-b) DSC melting and crystallization curves of Fraction B; (c) melting curves of Fraction B in CFR1 after SSA treatment (c). |
|
Figure 12 DSC melting and crystallization curves of Fraction C in CFR1. |
|
Table 1 Results of Two-stage Sequential Polymerization for PP/P(E-co-P) In-reactor Alloy |
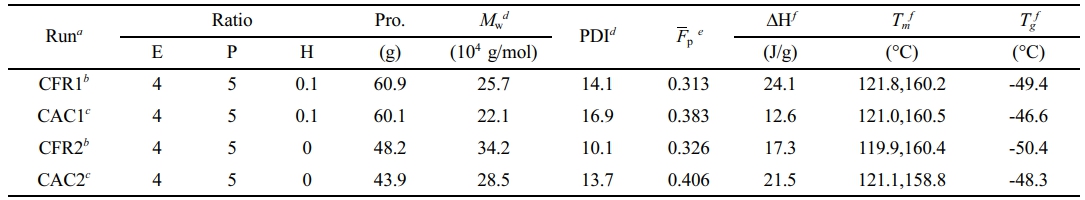
aPolymerization conditions for stage I: 60 mg of catalyst, 10 mL × 1 mol/L of TEA (Al/Ti=138.9), 18 mL × 0.1 mol/L of C-Donor (Si/Ti=25), 250 mL of n-hexane as diluent; propene pressure = 0.6 MPa, T = 40 °C, stir rate = 300 rpm, reaction time = 30 min. Polymerization conditions for stage II: The pressure regulators on gas feed lines of ethylene, propene and hydrogen were set to as near 0.40 MPa as possible. The pressure regulator on the drain line were set to 0.25 MPa and the three meters on the drain line were manually open with the openings of 50%, 100% and 100%, respectively. The Alicat flow meter showed that the temperature of the vented exhaust was near 30 °C and the pressure was maintained at 1 atm. Reactor temperature = 40 °C, stir rate = 100 rpm, reaction time = 72 min. bThe DCS controlled the three flow controllers on the feed lines to feed ethylene, propene and hydrogen with a constant volume flow ratio (CFR) and the reactor pressure was maintained at 0.30 MPa. cThe DCS controlled the three flow controllers on the feed lines to feed ethylene, propene and hydrogen with a constant atmosphere composition (CAC) in reactor and the reactor pressure was maintained at 0.30 MPa. dDetermined by GPC. eMolar fraction of propene in alloy, determined by 13C NMR. fDetermined by DSC from the second melting curve. |
|
Table 2 Results of Gas-phase Copolymerization in Stage II |
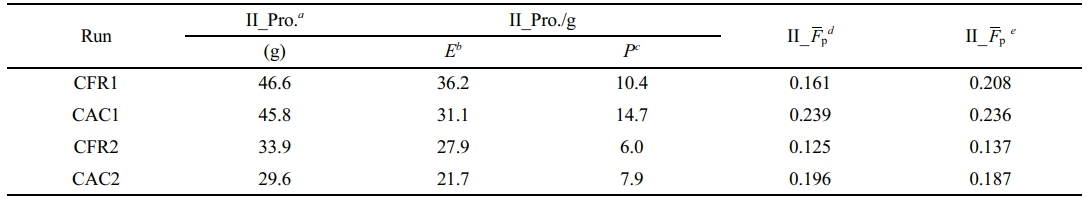
aPolymer yield in stage II, calculated according to the polymer yield in stage I and the polymer yield in two-stage sequential polymerization. bMass of the incorporated ethylene in stage II, calculated according to the polymer yield and the molar fraction of propene in alloy. cMass of the incorporated propene in stage II, calculated according to the polymer yield and the molar fraction of propene in alloy. dMolar fraction of propene in copolymer produced in stage II, calculated according to the mass of the incorporated ethylene and propene in stage II. eMolar fraction of propene in copolymer produced in stage II, calculated according to the integration of ethylene and propene consumption rates in gas-phase copolymerization. |
|
Table 3 Molecular Weights of Polymer Produced in Stage II |
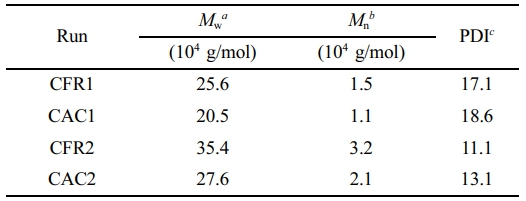
aWeight-average molecular weight. bNumber-average molecular weight. cPolymer dispersity index = Mw/Mn. |
|
Table 5 Composition and Sequence Distribution of Polymers After Decoupling |
aAverage ethylene sequence length, |
 .
. .
.|
Table 6 Lamellae Thickness and Crystalline Methylene Sequence Length Distribution |
|
Table 9 Molecular Weight and Polydispersity Index of Each Fraction of Alloys Determined by GPC |
|
Table 10 Composition and Sequence Distribution of Fractions A and B |
aAverage ethylene sequence length, |
 .
. .
.In this work, gas-phase copolymerization during preparation of polypropene in-reactor alloy was carried out under both constant ratio feeding mode and constant composition feeding mode. It was found that the polymerization behavior during the gas-phase stage was similar whether hydrogen was present or not.
By decoupling the alloy chain structure (molecular weight distribution and sequence structure distribution), the molecular weight distribution and sequence structure distribution of the gas-phase products were calculated. SSA analysis indicated that the lamellar distribution of the gas-phase products under the constant composition feeding mode was narrower than that under the constant ratio feeding mode. This suggests that maintaining a constant gas composition in the reactor under the constant composition feeding mode eliminates copolymer composition drift, resulting in a more uniform copolymer composition distribution in the gas-phase products.
Mechanical property testing of the alloy showed that both feeding modes produced toughened plastics, but the samples from the constant composition feeding mode exhibited higher elongation at break and better toughness. Solvent fractionation results indicated that the EPR content in the samples was around 50 wt%, and the tensile properties of the samples were most closely related to the mass fraction of Fraction B in the alloy samples. Compared to the constant ratio feeding mode, the samples prepared under the constant composition feeding mode had a higher mass fraction of Fraction B. The chain structure and properties of the three fractions after solvent fractionation were characterized by GPC, 13C NMR, and DSC. These findings provide valuable insights for optimizing gas feeding strategies in industrial production to improve the quality and performance of polymer products.
- 1. Zheng, Z.; Yang, Y. L.; Huang, K.; Hu, J. J.; Jie, S. Y.; Li, B. G. Real-time Detection of Atmosphere Composition in Three-component Gas-phase Copolymerization of Olefins. Macromol. Reaction Eng. 2018, 12, 1800042.
-

- 2. Zheng, Z. Gas-phase Copolymerization of Ethylene, Propene and Hydrogen Under Controlled Atmosphere Composition In Reactor. Polym. Korea 2025, 49, 187-196.
-
- 3. Wang, R.; Luo, Y. W.; Li, B. G.; Zhu, S. P. Control of Gradient Copolymer Composition in ATRP Using Semibatch Feeding Policy. AIChE Journal 2007, 53, 174-186.
-
- 4. Wilkens, J. B. High-conversion Drift-free Batch-type Addition Copolymerization, U.S. Patent Appl. US4048413, 1977.
- 5. Matsushita, Y.; Noro, A.; Iinuma, M.; Suzuki, J.; Ohtani, H.; Takano, A. Effect of Composition Distribution on Microphase-separated Structure From Diblock Copolymers. Macromolecules 2003, 36, 8074-8077.
-
- 6. Noro, A.; Iinuma, M.; Suzuki, J.; Takano, A.; Matsushita, Y. Effect of Composition Distribution on Microphase-separated Structure From BAB Triblock Copolymers. Macromolecules, 2004, 37, 3804-3808.
-
- 7. Gentekos, D. T.; Sifri, R. J.; Fors, B. P. Controlling Polymer Properties Through the Shape of the Molecular-weight Distribution. Nat. Rev. Mater. 2019, 4, 761-774.
-
- 8. Whitfield, R.; Truong, N. P.; Messmer, D.; Parkatzidis, K.; Rolland, M.; Anastasaki, A. Tailoring Polymer Dispersity and Shape of Molecular Weight Distributions: Methods and Applications. Chem. Sci. 2019, 10, 8724-8734.
-
- 9. Chakravarti, S.; Ray, W. H. Kinetic Study of Olefin Polymerization with a Supported Metallocene Catalyst. II. Ethylene/1-hexene Copolymerization in Gas Phase. J. Appl. Polym. Sci. 2001, 80, 1096-1119.
-
- 10. Debling, J. A. Modeling Particle Growth and Morphology of Impact Polypropylene Produced in the Gas Phase. Ph.D. Thesis. University of Wisconsin-Madison, America, 1997.
- 11. Han-Adebekun, G. C. Heterogeneous Catalyzed Gas Phase Polymerization of Olefins: Kinetic Studies and Modelling Investigations. Ph.D. Thesis. University of Wisconsin-Madison, America, 1997.
- 12. Hu, J. J. Studies on Homo- and co-polymerization of Propylene for Preparing Polyolefin Reactor Alloy. Ph.D. Thesis. Zhejiang University, China, 2006.
- 13. Tan, N. Effect of Temperature on Property Homo- and co-polymerization Kinetics and Microstructure of Polymer Made with Ziegler-Natta Catalyst. Ph.D. Thesis. Beijing University of Chemical Technology, China, 2015.
- 14. Zhang, B. Synthesis of Multicomponent Polyolefin Materials with Polyethylene and Polypropylene Matrix by Sequential Polymerization. Ph.D. Thesis. Zhejiang University, China, 2016.
- 15. Liu, W. F. Tailoring Ethylene/1-octene Copolymers in a Solution Copolymerization Process. Ph.D. Thesis. Zhejiang University, China, 2014.
- 16. Müller, A. J.; Arnal, M. L. Thermal Fractionation of Polymers. Prog. Polym. Sci. 2005, 30, 559-603.
-
- 17. Keating, M.; Lee, I. H.; Wong, C. S. Thermal Fractionation of Ethylene Polymers in Packaging Applications. Thermochimica Acta, 1996, 284, 47-56.
-
- 18. Zhang, M.; Wanke, S. E. Quantitative Determination of Short-chain Branching Content and Distribution in Commercial Polyethylenes by Thermally Fractionated Differential Scanning Calorimetry. Polym. Eng. Sci. 2003, 43, 1878-1888.
-
- 19. Zhang, F.; Fu, Q.; Lü, T.; Huang, H.; He, T. Improved Thermal Fractionation Technique for Chain Structure Analysis of Ethylene/a-olefin Copolymers. Polymer 2002, 43, 1031-1034.
-
- Polymer(Korea) 폴리머
- Frequency : Bimonthly(odd)
ISSN 2234-8077(Online)
Abbr. Polym. Korea - 2025 Impact Factor : 1.0
- Indexed in SCIE
 This Article
-
2026; 50(1): 114-127
Published online Jan 25, 2026
- 10.7317/pk.2026.50.1.114
- Received on Jul 21, 2025
- Revised on Sep 20, 2025
- Accepted on Sep 23, 2025
Services
- Full Text PDF
- Abstract
- ToC
- Acknowledgements
- Conflict of Interest
Introduction
Experimental
Results and Discussion
Conclusions
- References
Shared
Correspondence to
- Zheng Zheng
-
Zhejiang Industry Polytechnic College, 151 Qutun Road, Yuecheng District, Shaoxing, Zhejiang, China 312000
- E-mail: 20240017@zjipc.edu.cn
- ORCID:
0000-0003-4843-9381
Hyecheon Building(Room 601), #354, Gangnam-Daero, Gangnam-Gu, Seoul 06242, Korea
TEL : 82-2-568-3860, 561-5203, 569-3860 FAX : 82-2553-6938 E-mail: polymer@polymer.or.kr