


- Crystalline Structures and Transitions of Poly(phthalazinone ether sulfone)/Monomer Casting Nylon 6 Composites
Huimei Yao†
 , Yanping Wang, Chihua Chen, Jingrui Zhu, and Xiaochun Xiao
Ji’an Vocational and Technical College, Ji’an 343000, Jiangxi, China
- Poly(phthalazinone ether sulfone)/Monomer Casting 나일론 6 복합소재의 결정 구조 및 전이 연구
Reproduction, stored in a retrieval system, or transmitted in any form of any part of this publication is permitted only by written permission from the Polymer Society of Korea.
The crystalline structures and transitions of poly(phthalazinone ether sulfone) (PPES)/monomer casting (MC) nylon 6 composites were studied by wide-angle X-ray diffraction (WXRD) and Fourier-transform infrared (FTIR) spectroscopy. WXRD analyses demonstrated that the γ-form crystals of quenched samples could transform into a-form crystals by raising the annealing temperature. And increasing the PPES content promoted the γ→α form transition, which was conducive to crystallizing in the stable α-form crystal. FTIR analyses indicated that the α-form crystals of the pristine samples could transform to γ-form crystals through treating with aqueous I2/KI. The inclusion of PPES to MC nylon 6 hindered the α→γ form transition, which was conducive to crystallizing in the stable α-form crystal. Two consistent observations have come from these studies: PPES favored the α-form crystal in PPES/MC nylon 6 composites. The crystalline transition mechanism was the strong interactions between PPES and MC nylon 6 anchored the antiparallel chains hydrogen bonding of the a-form crystal.
Wide-angle X-ray diffraction (WXRD) and Fourier-transform infrared (FTIR) spectroscopy were used to study the crystalline structures and transitions of poly(phthalazinone ether sulfone) (PPES)/monomer casting (MC) nylon 6 composites through the Gaussian curve-fitting method and the Lorentzian curve-fitting method, respectively. Results show that two consistent observations have come from these studies: PPES favored the ¥á-form crystal in PPES/MC nylon 6 composites.
Keywords: poly(phthalazinone ether sulfone), monomer casting nylon 6, composite, crystalline structure, crystalline transition.
The authors would like to express their gratitude to the Educational Department in Jiangxi Province (China) for their support through a Grant-in-Aid for Scientific Research (No. GJJ219401).
The authors declare that there is no conflict of interest.
Information is available regarding the fitting results of FTIR curves of samples treated with I2/KI solution in different time (Table S1). The materials are available via the Internet at http://journal.polymer-korea.or.kr.
PK_2023_047_04_417_Supporting_Information_template.pdf (174 kb) Supplementary Information
As the physical property of crystalline polymers such as the thermal, mechanical, barrier, and degradation properties, depend strongly on crystallization morphology and structure.1 The crystallinity, relative content of different crystalline phases, crystallite size and perfection content, and orientation of crystallites are key factors in determining the properties of crystalline polymers.2 Therefore, the study of the crystalline morphology of polymer matrix has always been the focus of research on the structure and properties of polymer matrix composites.3-5 Most semicrystalline polymers can form different polymorphs or crystal modifications by varying the crystallization or processing conditions.6-8 Nylon 6 is commercially important and one of the prominent members of the polyamide class of semicrystalline polymers.9-13 The polymorphic structures of nylon 6 result from the different spatial arrangements in the hydrogen bonding between the oxygen in the carbonyl group of one polyamide molecular chain and the hydrogen attached to the nitrogen in the neighboring polyamide molecular chain.3,14 Nylon 6 forms two types of crystals: α and γ.15-17 The γ-form polyamide crystal is constituted by polyamide molecules adopting the parallel-chain-arrangement hydrogen bondings in a twisted conformation, and the hydrogen bonding direction is almost perpendicular to the carbon frame plane. Whereas the polyamide molecules in the monoclinic α-form crystal have taken the more stable antiparallel-chain-arrangement hydrogen bondings and lie in an extended zigzag planar fashion. Antiparallel chains are situated so that the amide linkage and methylene units lie within the same plane, and the hydrogen bondings occur between adjacent antiparallel chains in a fully extended conformation, to form hydrogen-bonded sheets stacked upon one another. The a-form is more stable than the g-form because of shorter hydrogen bondings.18 At room temperature, nylon 6 usually forms a stable α-form crystal. On the X-ray diffraction pattern, the characteristic diffraction peaks of γ-form crystal are at 2θ=20° and 24°, and are indexed as 200 and 002/202 reflections, respectively. In the g-form, these peaks are indexed as 001 reflections and appear at 2θ=21°. These two form crystals are very sensitive to the way of preparing samples, the crystal transformation occurs through different treating means.19 On the other hand, the crystallization behavior of nylon 6 changes significantly due to that the additive in nylon 6 matrix composites can change the physical and chemical environment of the nylon 6 melt.20 Therefore, elucidating the relationships between polymorphic crystalline structure and transition, crystallization condition, and the effect of additive is of fundamental importance for tuning the crystallization behavior of nylon 6 in processing.
MC nylon 6 as a kind of nylon 6 is an important engineering plastic. As poly(phthalazinone ether sulfone) (PPES)/monomer casting (MC) nylon 6 composites were successfully prepared for the first time through anionic in-situ ring-opening polymerization,21,22 there are few studies on the crystalline structures and transitions of PPES/MC nylon 6 composites. In this study, we would like to investigate the effect of PPES content, annealing temperature, and treating with aqueous I2/KI on crystalline structures and crystal transitions of MC nylon 6 matrix by using WXRD and FTIR.
Sample Preparation. PPES/MC nylon 6 composites were prepared through anionic in-situ ring-opening polymerization with the PPES mass percentage of 0.0, 0.5, 2.0, 4.0, and 6.0 wt%, the method was elaborated in detail in our previous paper.23 Thick films with a dimension of 20 mm×10 mm×1 mm and thin films with a thickness of 30-40 mm were obtained by mechanical incision. Both types of films were extracted in distilled water to remove the remaining monomer and small molecular polymer and then dried in a vacuum oven at 80 ℃ for 24 h. The thick films were melted at 270 ℃ for 30 min and then quenched to liquid nitrogen temperature. The quenched samples were annealed in a large test tube full of nitrogen at 130, 150, and 210 ℃ for 2 h, respectively. Thin films were iodinated by immersing the films in an aqueous solution of 0.2 mol L-1 KI and 0.2 mol L-1 I2 at room temperature for 5 min to 24 h. The films were then rinsed with distilled water for 2 min to remove excess iodine from the film surface, followed by drastic removal of the excess iodine and potassium iodide with sodium thiosulfate. The samples were then dried at room temperature.
Wide-angle X-ray Diffraction (WXRD). WXRD measurements were performed using a Bruker D8 Advance powder X-ray diffractive apparatus with CuKa radiation (40 kV, 40 mA) and a wavelength of 1.54 nm. The diffractograms were scanned in 2θ with the range from 5 to 35° at a rate of 2.0°/min. A curve-fitting procedure with the Gaussian method was used to resolve selected X-ray diffraction curves and determine the area under the peaks.
Fourier-transform Infrared (FTIR). The IR spectra were collected at a resolution of 2 cm-1 in the range of 400-4000 cm-1 using a NexusTM FTIR from the Nicolet company. Sets of 32 scans were used for signal averaging. The thin film can be directly tested in the sample compartment of the FTIR. A curve-fitting procedure with the Lorentzian method was used to resolve selected IR bands and determine the area under the peaks.
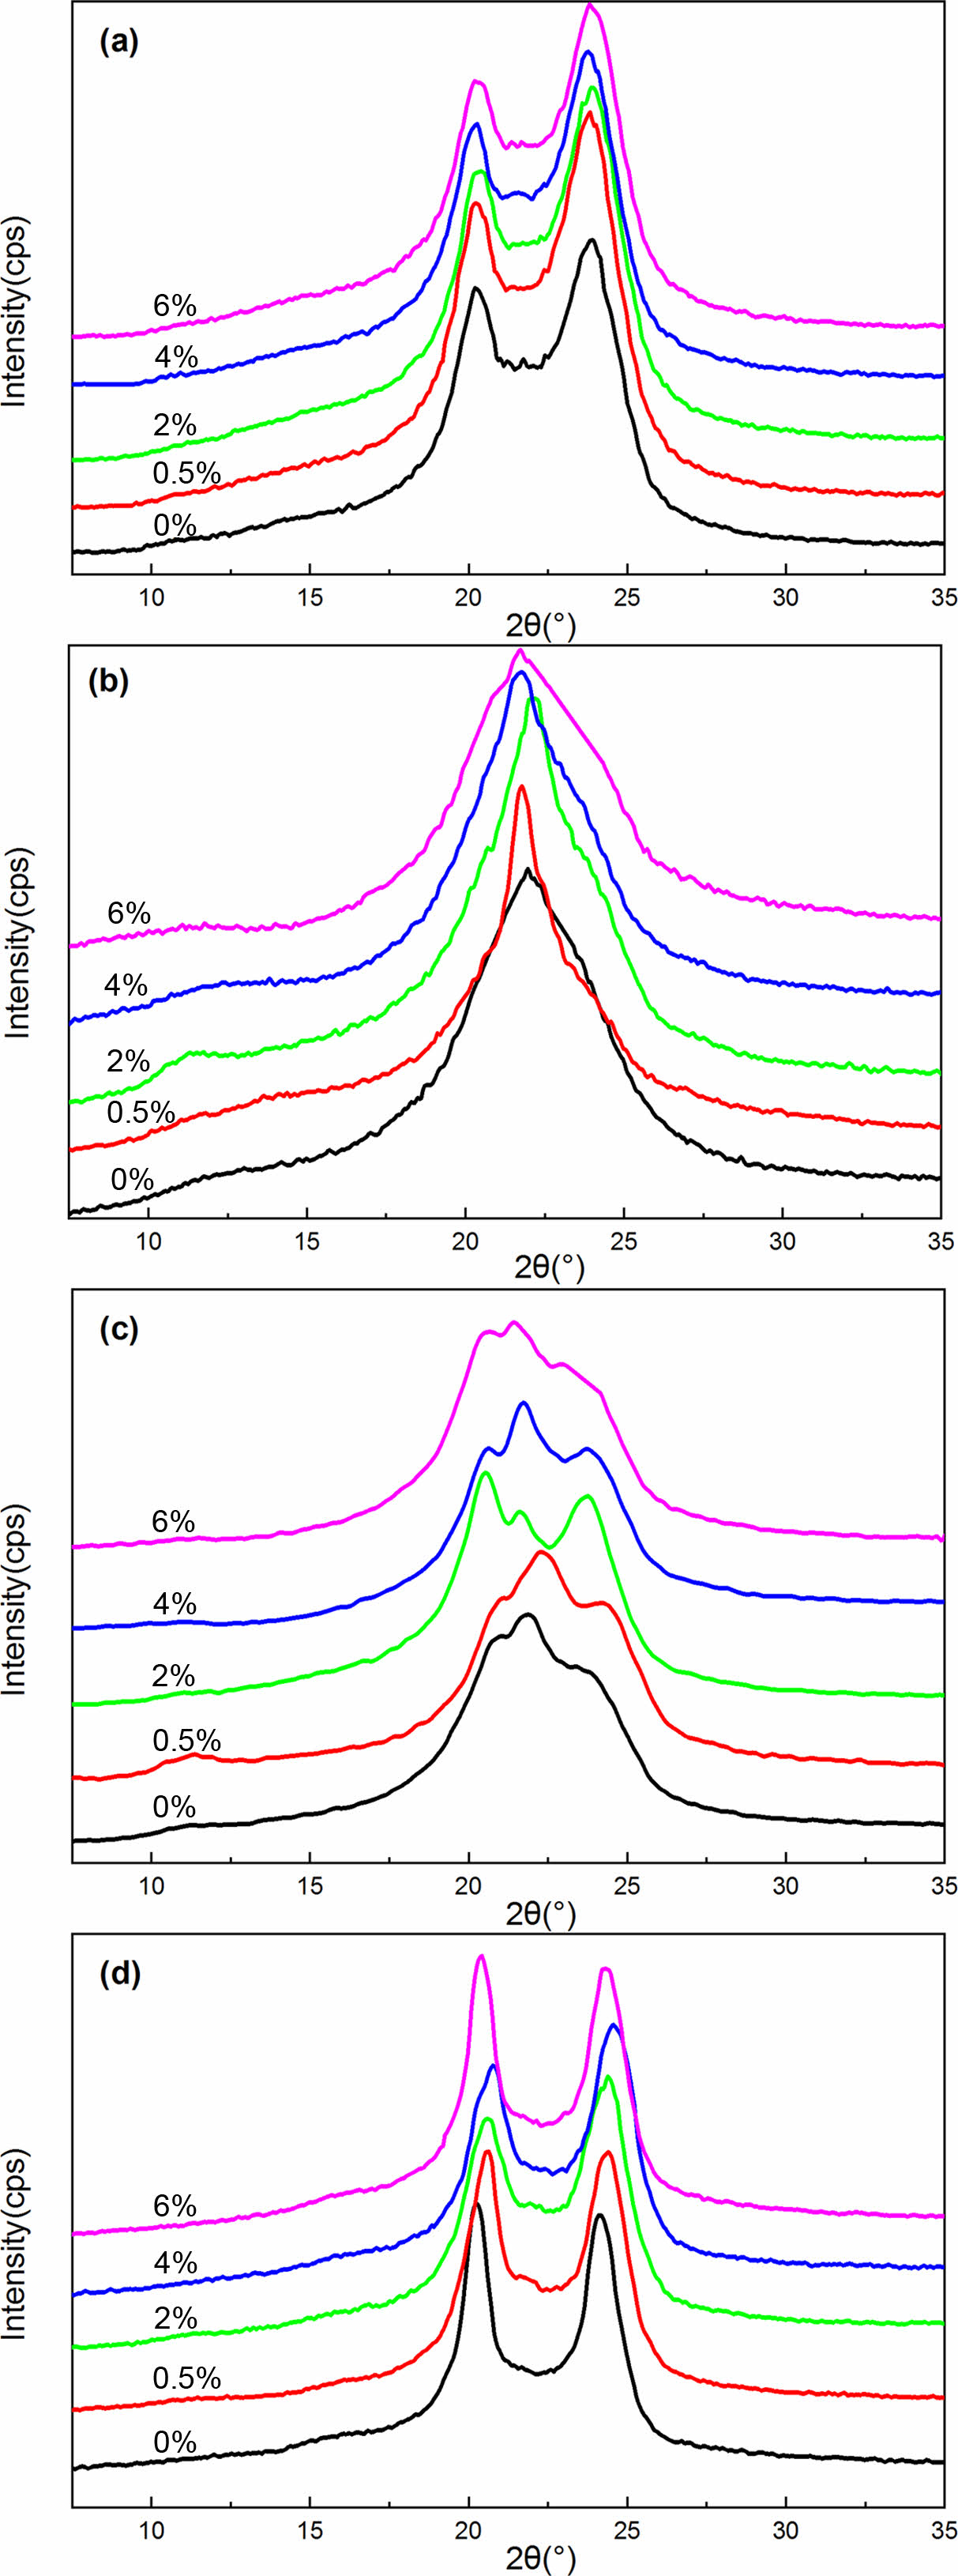
WXRD Analysis. Studies have indicated that rapid cooling or quenching from the melt produces the g-form of nylon 6, while higher crystallization temperatures or slow cooling leads to the a-form.24,25 Annealing at different temperatures also affects the crystal structure. Annealing below 130 ℃ only produces the g-form crystal, treating above 200 ℃ leads to the a-form crystal, annealing between 130~200 ℃, two crystal forms coexist.26 Kyotani and Mitsuhashi attribute the temperature dependence to the crystallization rates of the two forms, i.e. at temperatures below 130 ℃ the rate of formation of γ-form is faster, while above 190 ℃ the crystallization rate of α-form is faster, while at intermediate temperatures, the rates are comparable.26 Considering that the crystallization rate is related to polymer chain mobility, Fornes combined with Kyotani’s point proposed nylon 6 tends to form the g-form crystal when the movement of the molecular chain segment is hindered.27 Figure 1 shows the WXRD spectra of pure MC nylon 6 and its composites crystallized under different treatment temperatures. As can be seen clearly, these results are in accord with the literature.
Figure 1(a) shows the WXRD spectra of pure MC nylon 6 and its composites. Two strong diffraction signals around at 2θ=20° and 24°can be seen in all curves of Figure 1(a), which match the 200 and 002/202 crystal planes of the characteristic peak of triclinic (α1 and α2) crystalline structure in MC nylon 6, which demonstrated that inclusion of PPES to MC nylon 6 did not change the crystalline structure of MC nylon 6. Similar results have been reported by Reynaud et al.28 However, the a1 and a2 crystals differed in the relative intensity of diffraction peaks between 2θ=20° and 24°. To further investigate the crystal structure of MC nylon 6 and its composites, the resulting plots of X-ray intensity versus 2θ were analyzed using the Gaussian curves fitting program. This part will be detailed and discussed later with the samples annealed at 210 ℃ for 2 h.
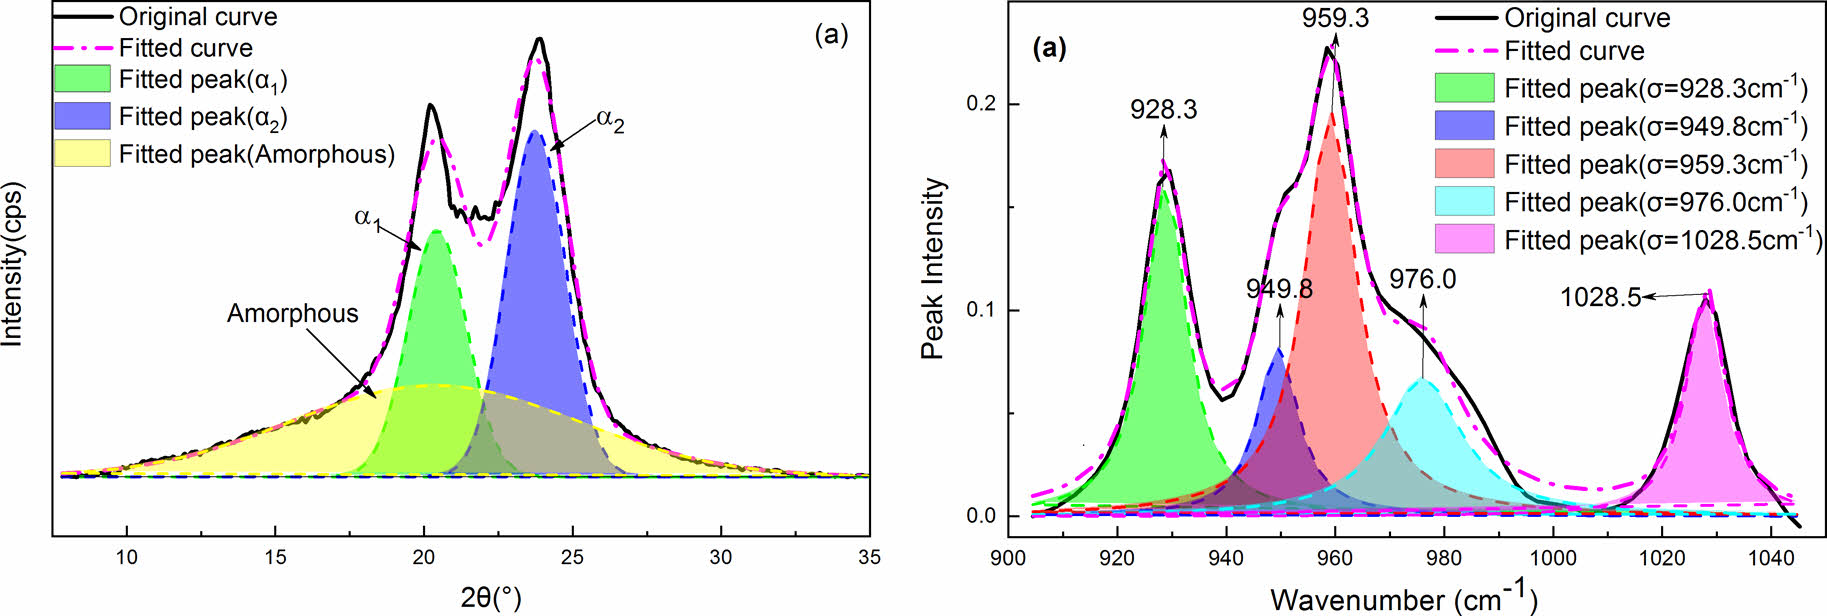
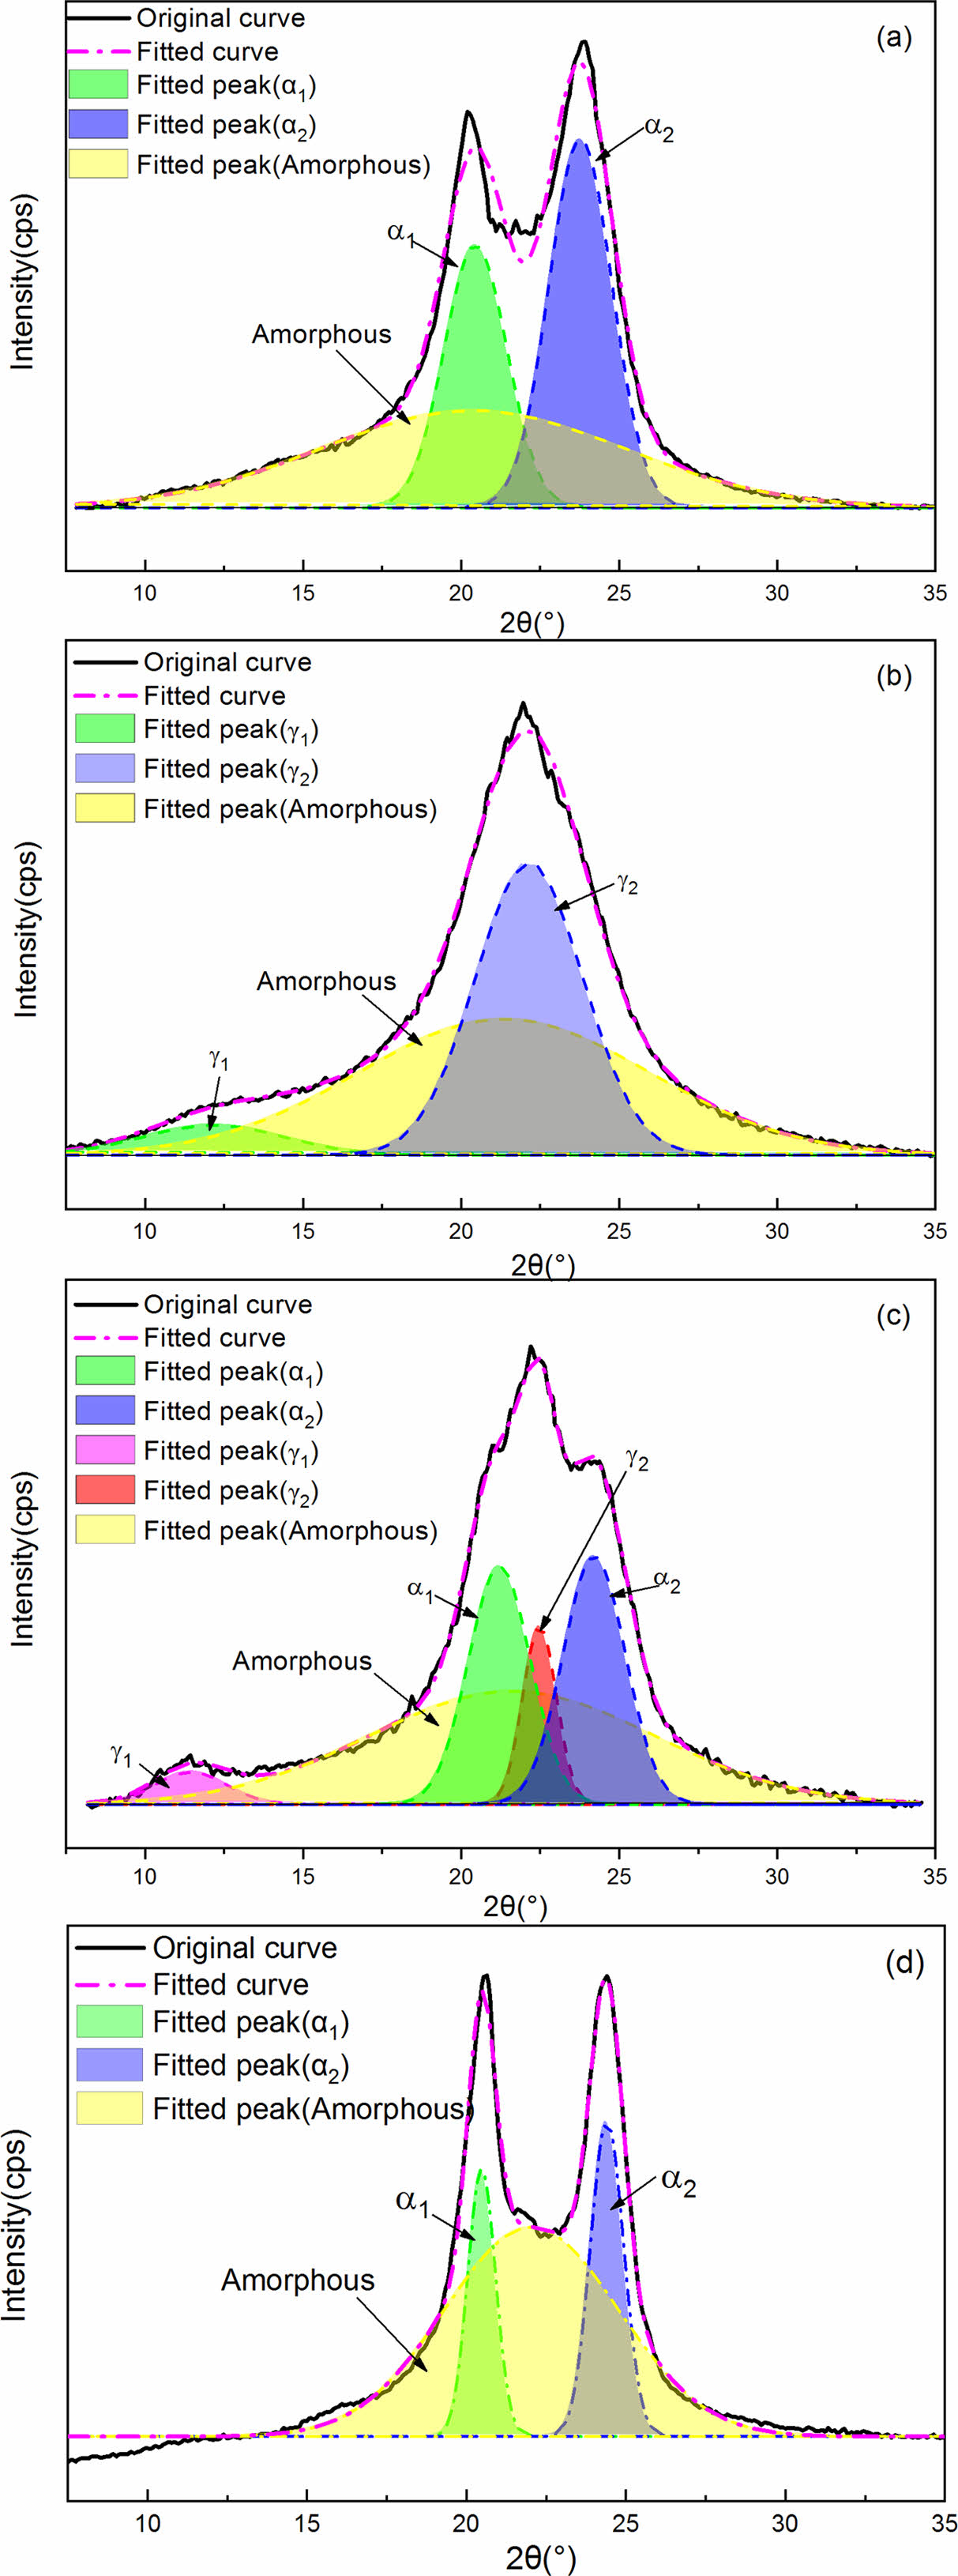
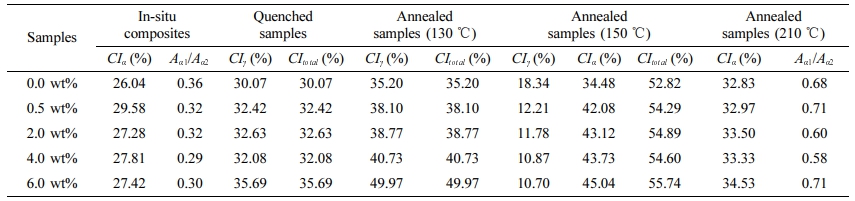
The effect of PPES on the crystalline structure and γ→α crystal transformation of MC nylon 6 can be further analyzed through deconvoluting the X-ray diffraction curves of all samples with Gaussian curves following the work by Gurato and Ho Jia-Chong et al.18 Figure 2 are four representative examples of the diffraction curves that had been resolved into crystalline and amorphous scattering components using the peaking fitting software. For example, the X-ray diffraction curves of the pristine samples and the samples annealed at 210 ℃ for 2 h can be deconvoluted into three components. The three components consisted of (200)α1 and (002/202)α2 diffraction peaks appearing at 2θ=20.4-20.6° and 23.7-23.9°, represented the α1 and α2 crystalline structure, respectively, and a broad peak due to the amorphous region as shown in Figure 2(a) and 2(d). The crystallinity indices, CIa, as defined in eq. (1), where Aa1 and Aa2 are the areas under the α1-form and α2-form crystal peaks, respectively. Aa is the area under the amorphous peak.
The X-ray diffraction curves of the quenched samples can also be deconvoluted into three components. The three components consisted of (020)γ1 and (200)γ2 diffraction peaks appearing at 2θ=11.6° and 22.2°, respectively, and a broad peak due to the amorphous region as shown in Figure 2(b). The crystallinity indices, CIγ as defined in eq. (2), where Aγ1 and Aγ2 are the areas under the γ-form crystal peaks, and Aa is the area under the amorphous peak.
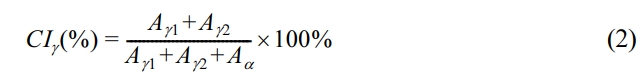
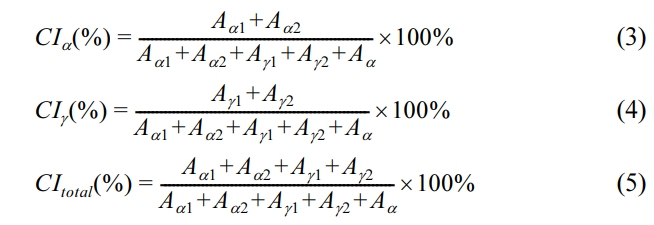
Similarly, we deconvoluted the X-ray diffraction curves of the samples annealed at 150 ℃ for 2 h into five components by approximating peaks with Gaussian curves. The five components consisted of (020)γ1, (200)γ2, (200)α1, and (002+202)α2 diffraction peaks appearing at 2θ=11.3°, 22.4°, 20.3°, and 24.0°, respectively, and a broad peak due to the amorphous structure as shown in Figure 2(c). The crystallinity indices, CI, as defined in Eq. 3, 4, and 5, where CItotal is the sum of CIα and CIγ, and the other symbols are the same as in eq. (1) and (2).
The CIα, CIγ, CItotal, and Aα1/Aα2 in pure MC nylon 6 and its composites treated at different temperatures are presented in Table 1. The CIα and CItotal values increased slightly as the content of PPES increased in composites, indicating that the addition of PPES to MC nylon 6 increased the crystallinity. This finding was consistent with our previous study.23 According to the crystal structure and cell parameters of nylon 6, the intermolecular hydrogen bonding of nylon 6 is formed in the c-axis direction. That is, the intermolecular interaction in the c-axis direction is greater than that in the a-axis direction. The molecular chain is conducive to arranging in the c-axis direction under crystallization. The diffraction peak intensity of 002 and 202 crystal planes is greater than that of 200 crystal planes. Therefore, the Aα1/Aα2 values of MC nylon 6 and its composites were less than 1. And the Aα1/Aα2 values decreased slightly as the content of PPES increased, it can be illustrated that the inclusion of PPES to MC nylon 6 was more favorable to molecular arrange in the c-axis direction during crystallization. It is not difficult to see that the CIα, CItotal, and Aα1/Aα2 values in annealed samples at 210 ℃ for 2 h were higher than that of pristine samples, the CIα and CItotal values increased slightly with the increase of PPES content. All the Aα1/Aα2 values were also less than 1 but had no significant change rule with the increase of PPES content. Studies have shown that, during the annealing process the macromolecules of the polymer are regularly rearranged, and transformed from a non-equilibrium state to an equilibrium state.29,30 And the dates indicated that the rearrangement extent of the molecular chain in the a-axis direction was greater than that in the c-axis direction during the annealing process, but the increase in PPES content had little effect on the rearrangement degree of the molecular chain in the a-axis direction.
Under quenching treatment, the α→γ form transitioned completely. The CIγ of quenched samples increased with PPES content increasing. After annealing, the CIγ was higher than that of quenched samples, and the CIγ increased gradually with the increase of PPES content. The results showed that the macromolecules of polymers were more regularly arranged during the annealing process, and changed from a non-equilibrium state to an equilibrium state.
Under annealing treatment at 150 ℃ for 2 h, the CIγ decreased, but the CIα and CItotal increased with PPES content increasing. The γ-form crystal transformed entirely to α-form under annealing at 210 ℃ for 2 h. These data suggested that γ→α form transition can be achieved by raising the annealing temperature and increasing the PPES content can promote the γ form transition. The results can be explained as follows: the anchoring effect from the interaction between PPES and MC nylon 6 twisted the unstable parallel chains hydrogen bonding of the α-form crystal to antiparallel chains hydrogen bonding of thea-form crystal. That is to say, PPES favored the a-form crystal in PPES/MC nylon 6 composite.
FTIR Analysis. The α-form of nylon 6 is most commonly observed at room temperature and can be transformed into the γ-form by treating in an aqueous iodine-potassium iodide solution.16 Since crystal transformation of nylon 6 was first reported by treating with I2/KI aqueous solution, many scholars have used FTIR, XRD, and other characterization methods to study the α→γ crystal transformation in nylon 6 after treatment with I2/KI aqueous solution.27,31 H. Arimoto used X-ray diffraction and polarization microscopic infrared absorption to study the α→γ transition mechanism of nylon 6 treated with I2/KI aqueous solution.32 Based on earlier research, we mainly studied the effect of PPES on the α→γ transition of MC nylon 6 using FTIR.
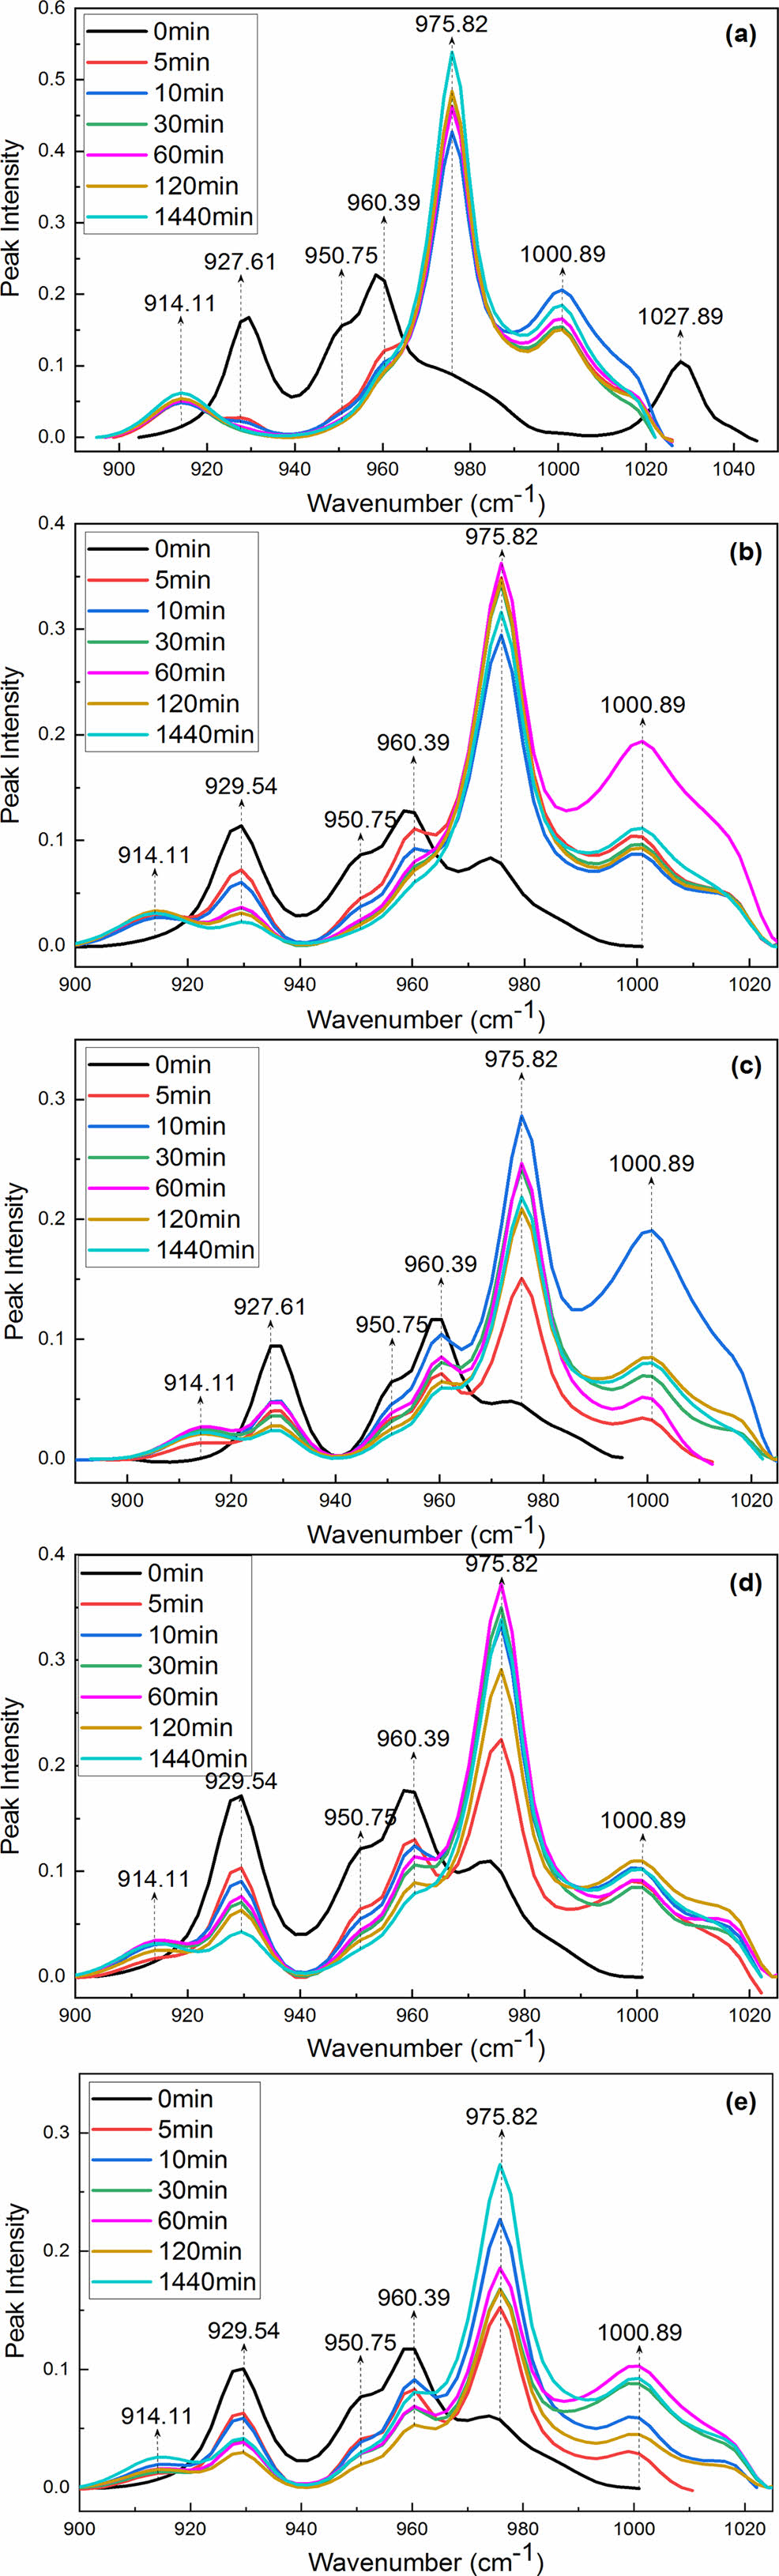
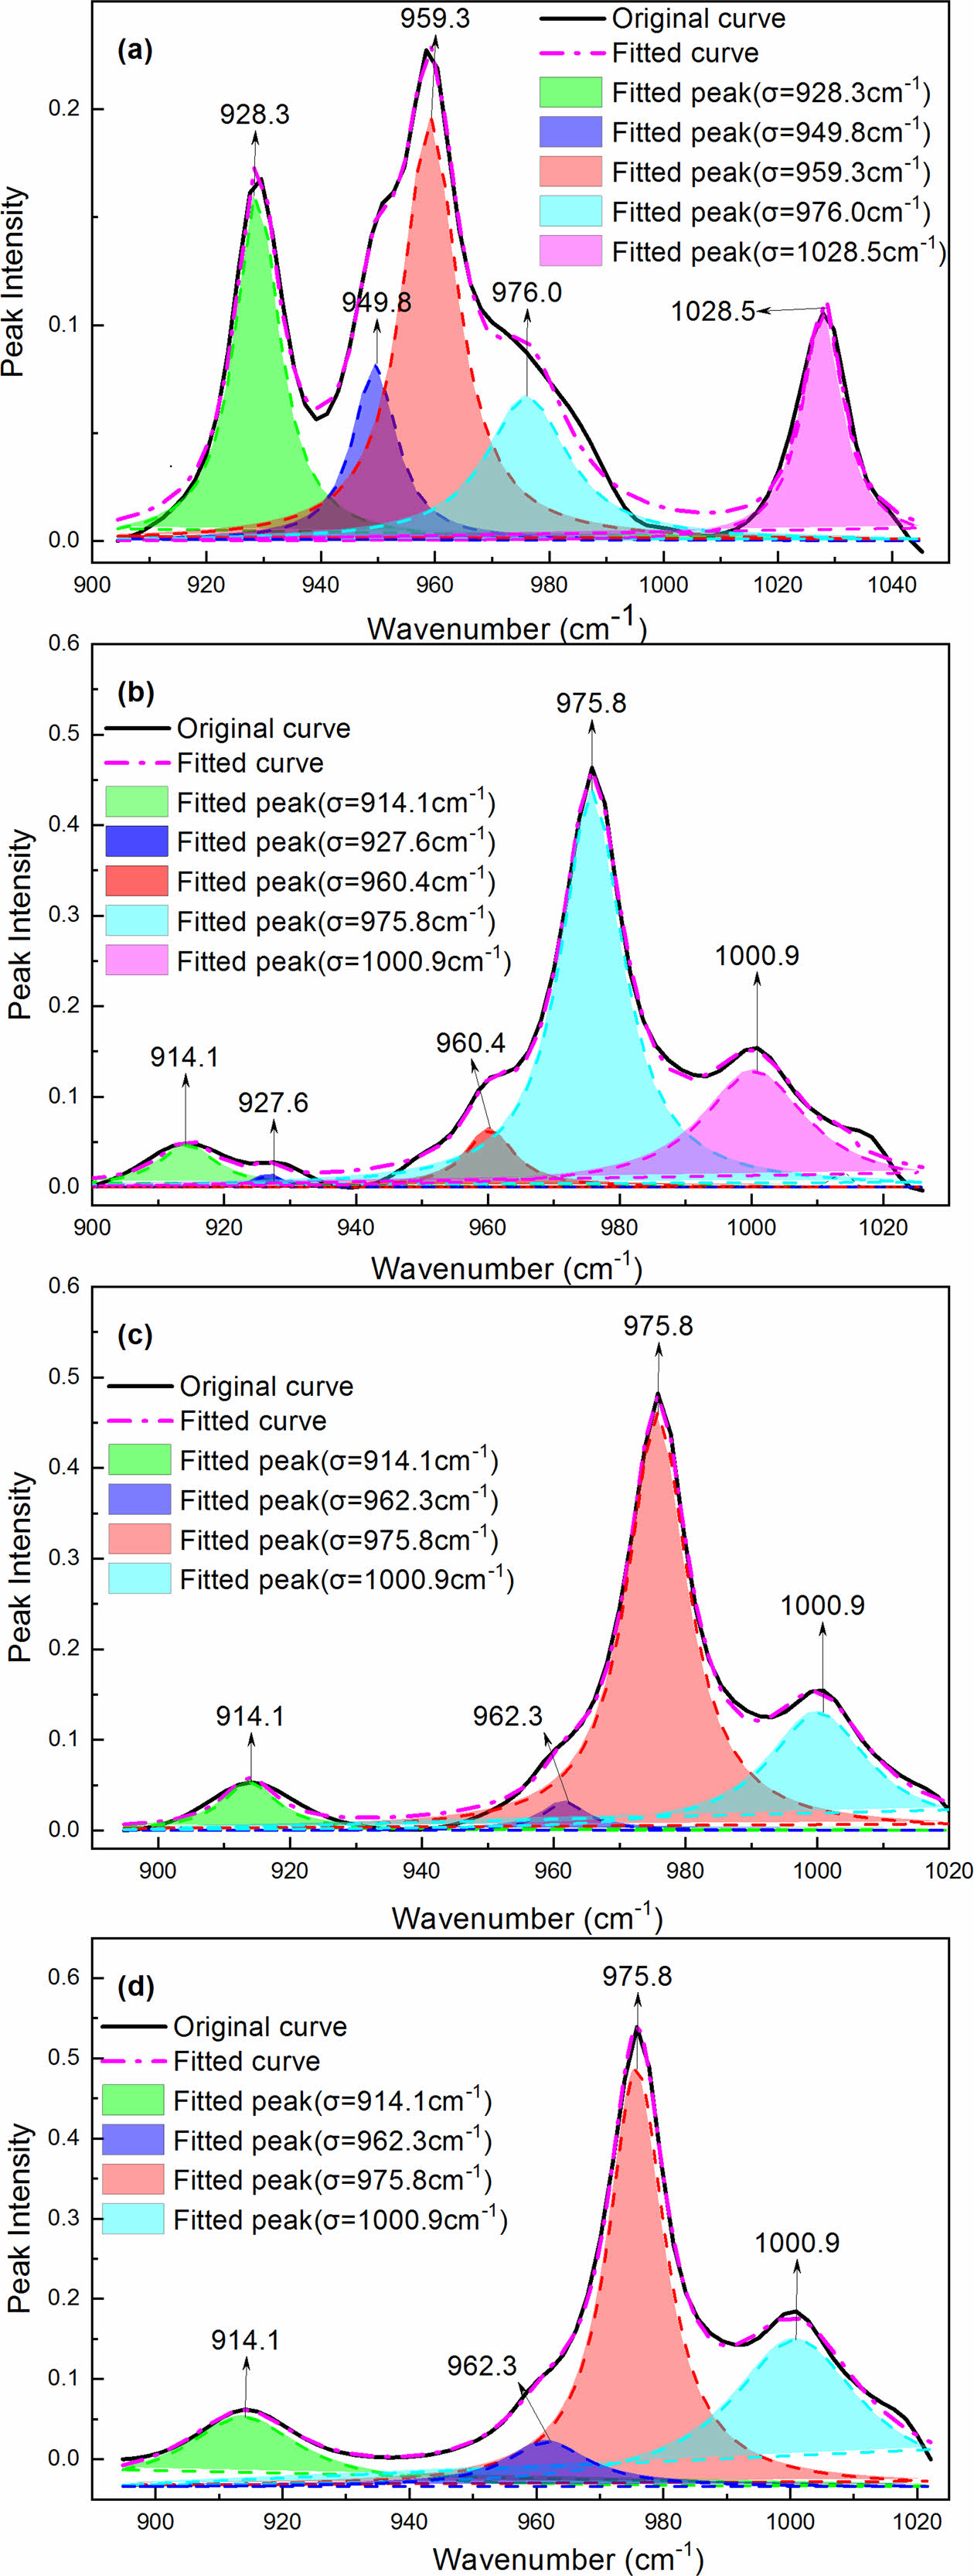
The FTIR spectra of nylon 6 include many absorption bands associated with the crystal form: 1236 (m), 1001 (w), 977 (m), 776 (vw), 730 (m), and 712 cm-1 (s) are related to the γ-form crystal, whereas 1293 (w), 1202 (m), 1041 (vwsh), 1029 (m), 960 (m), 952 (w), 929 (m), 835 (w), and 731 cm-1 (m) are related to the α-form crystal.33 Based on the literature and our actual measurement results, we believe that it is satisfactory to use the change of absorption intensity of 928 and 960 cm-1 to characterize the content of a-form crystal and the change of absorption intensity of 914 and 976 cm-1 to characterize the content of γ-form crystal. The two bands are sensitive to the change in crystal content. For convenience, we describe the results obtained in a major spectral region.
The FTIR spectra in the range 900-1020 cm-1 for the samples untreated and treated with aqueous I2/KI recorded as a function of time are shown in Figure 3. Figure 3(a) shows that MC nylon 6 mainly exists in the a-form, and the γ-form is only a shoulder peak. On increasing the treatment time from 0 to 1440 min, the characteristic absorption peak intensity of the α and γ crystal in MC nylon 6 and its composites changed dramatically. When we treated MC nylon 6 with aqueous I2/KI from 0 min to 1440 min, the strong absorption bands at 928 and 960 cm-1 assigned to a-form crystalline bands decreased dramatically, then the band at 928 cm-1 disappeared when the treating time was 30 min, the band at 960 cm-1 became weaker and broader with the treating time extending. However, two other bands, at 914 and 976 cm-1 assigned to γ-form crystalline bands abruptly appeared, even though the treating time was only 5 min, and there was a steady increase in the intensity of the two bands with the treating time extending. These results indicated that the α-form crystal of MC nylon 6 can be fast and completely transformed into the γ-form crystal by treating it in aqueous I2/KI. As can be seen from Figure 3(b, c, d, e), the inclusion of PPES to MC nylon 6 distinctly affected the extent of the α→γ transition. The intensities of the band at 928 cm-1 decreased continuously with increasing treating time, but the band didn’t disappear even though the treating time was extended to 1440 min. Some other bands, at 914, 960, and 976 cm-1, on increasing the treating time had similar change trends but showed different intensity compared with that of MC nylon 6. Interestingly, the characteristic absorption peak intensity of the α and γ crystals depended critically on PPES content.
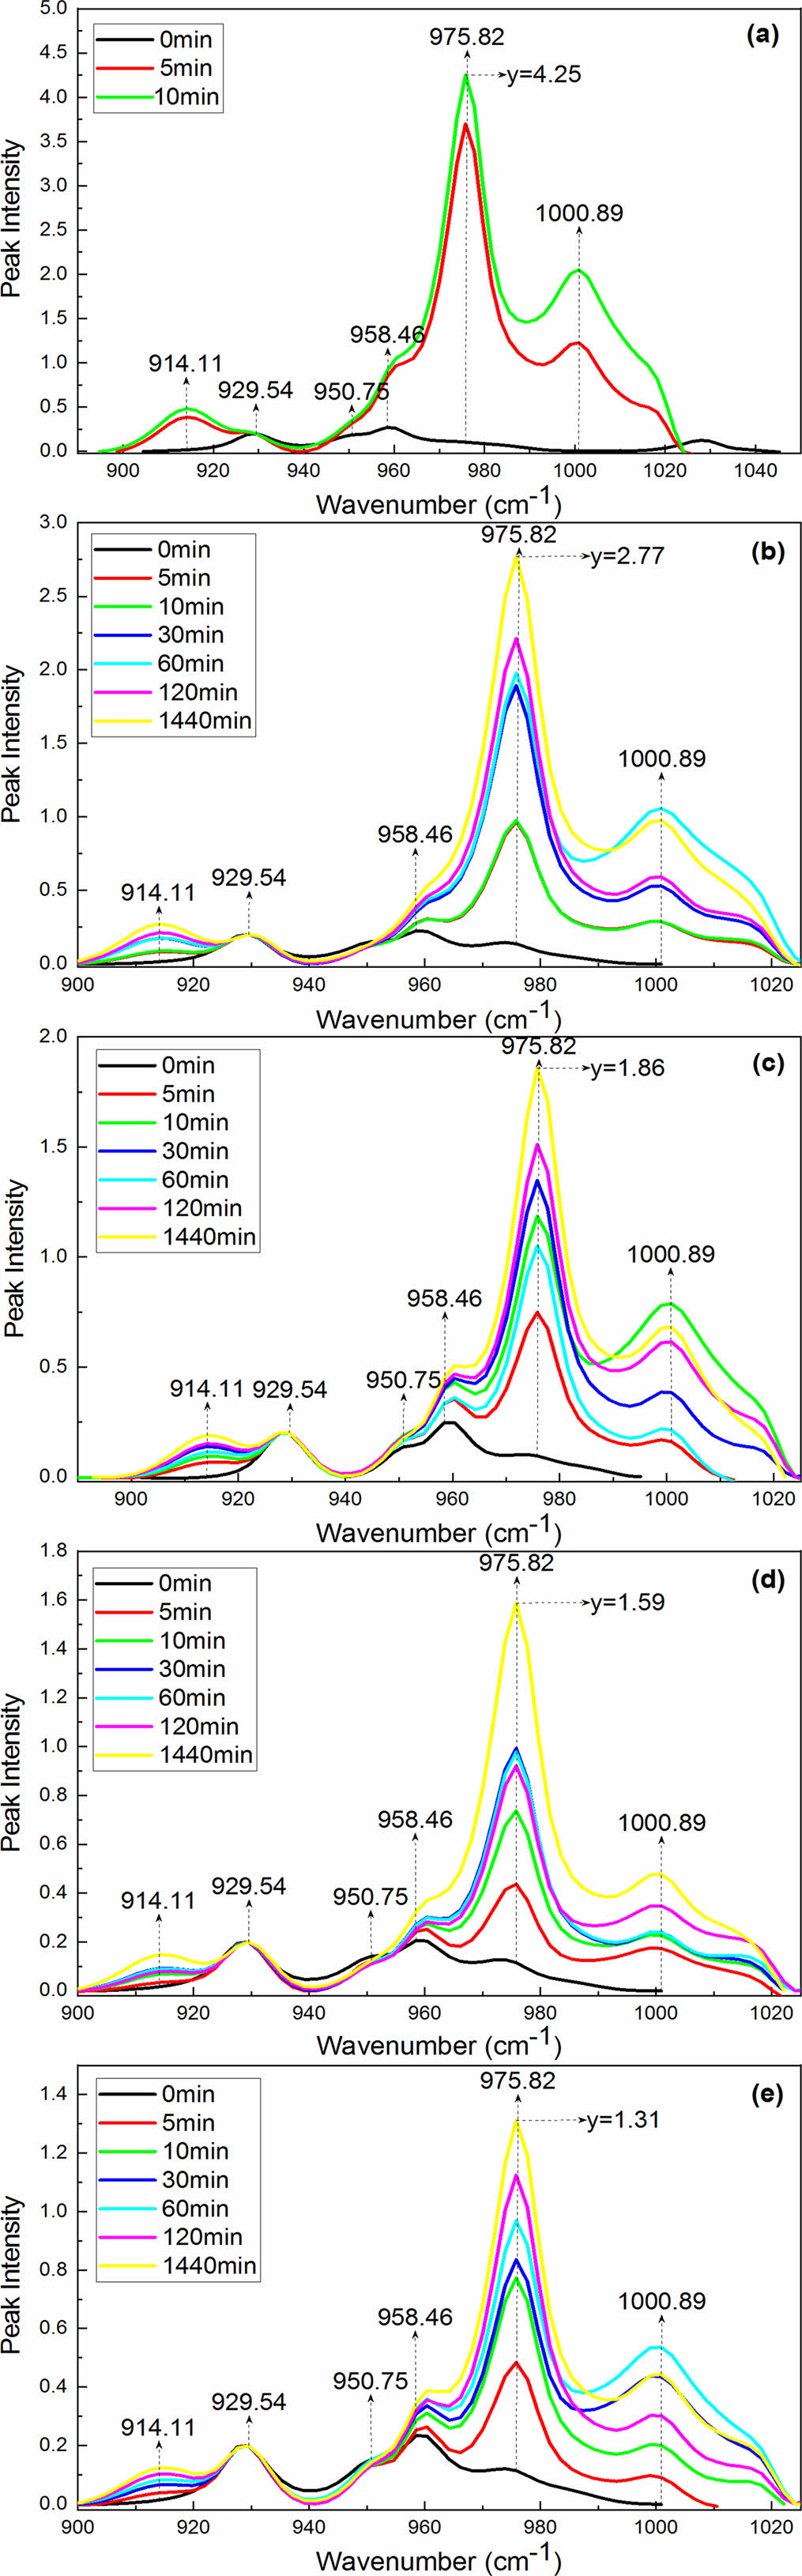
For the convenience of further discussion, the normalized intensity of the 928 cm-1 bands (characteristic band of the α-form crystal) was evaluated and plotted as a function of the treating time in Figure 4. In the treating process of the samples with aqueous I2/KI, the intensity of the 976 cm-1 bands (characteristic band of γ-form crystal) increased remarkably and regularly
upon treating from 0 to 1440 min. The intensity of the 914 cm-1 bands (characteristic band of γ-form crystal) also showed a gradual increase in the time range of 0-1440 min. While the intensity of the 960 cm-1 bands (characteristic band of α-form crystal) became weaker and broader with the treating time extending. These results further confirmed the occurrence of α to γ phase transition during treating with aqueous I2/KI. However, the intensity of the 976 cm-1 bands decreased gradually with the PPES content increasing in the normalized FTIR analysis, obtaining the Y values of 4.25, 2.77, 1.86, 1.59, and 1.31, respectively (Figure 4). The results clearly indicated that increasing the PPES content can hinder the α→γ form transition.
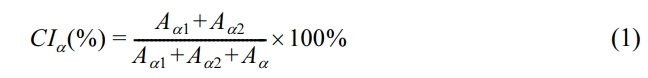
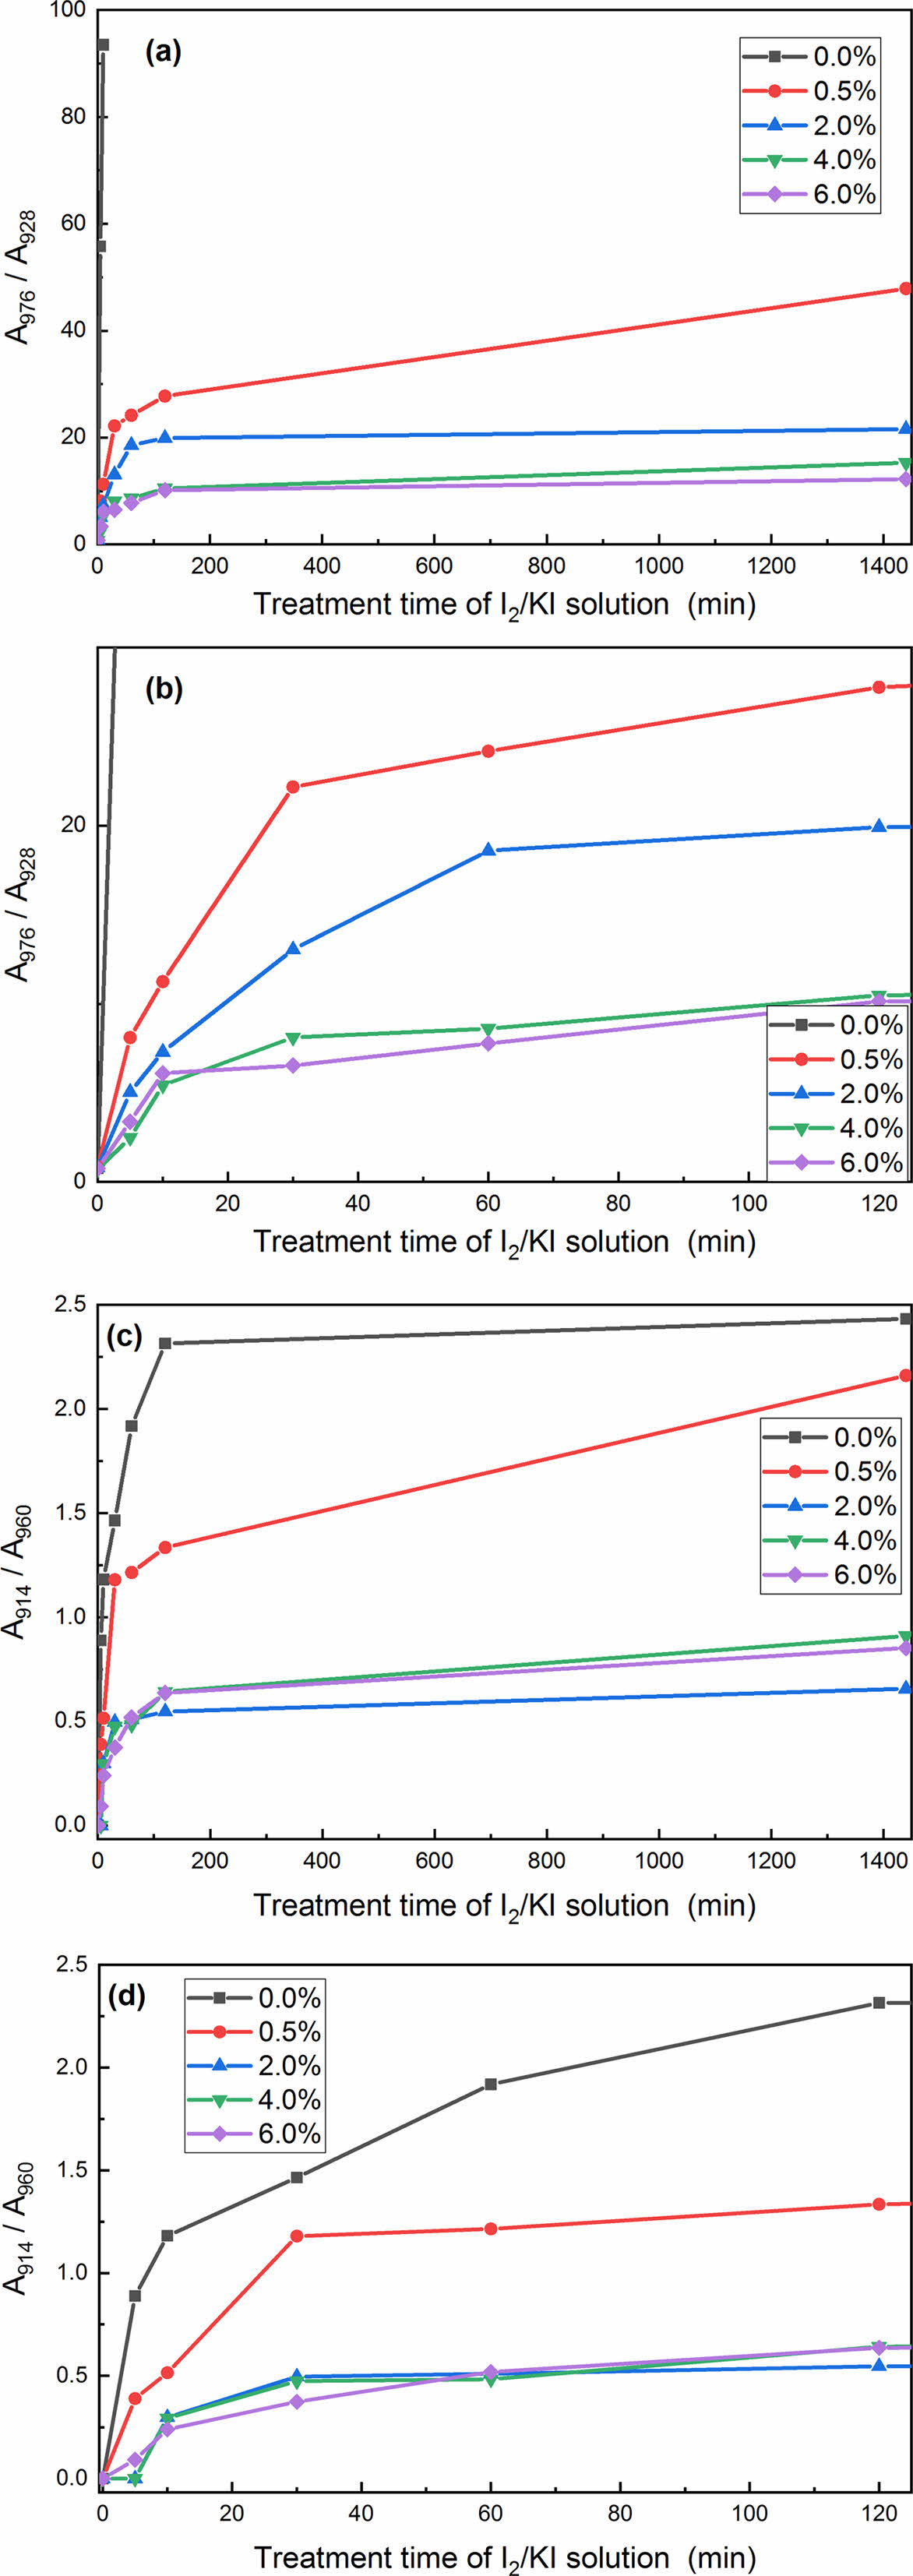
To quantitatively study the change of crystallinity with treating time and PPES content increasing, each peak was modeled using a Lorentzian peak shape. Figure 5 are four representative examples of FTIR curves that have been resolved into independent components using the peaking fitting software. Areas of the peaks obtained from the analysis were used to estimate the degree of crystallinity for each phase. Despite the good agreement, the degree of crystallinity obtained via this analysis should be treated as approximate, since the initial guess for each peak will influence these results. In view of this, the ratio of A976/A928 (A976 and A928 express the areas of the absorption peaks at 976 cm-1 and 928 cm-1, respectively), and A914/A960 (A914 and A960 express the areas of the absorption peaks at 914 cm-1 and 960 cm-1, respectively) to illuminate the α→γ transition extent. The analysis results are shown in Table S1.
The dependencies of the A976/A928 and A914/A960 on treating time for MC nylon 6 and its composites are shown in Figure 6. It can be seen from Table S1 and Figure 6, the speed of transition was rapid during the first 30 min, whereas increased treating time, the α→γ transition proceeded more slowly, even though the time extended to 24 h. On the other hand, the α→γ transition speed of the composites decreased with the increase of PPES content, indicating that the inclusion of PPES to MC nylon 6 hindered the α→γ transition. According to the literature, the antiparallel hydrogen bonding of the α-form crystal firstly be destroyed by the iodine, then the molecular chain twisted to parallel hydrogen bonding of the γ-form crystal in the treating process with aqueous I2/KI, due to the coordination of the iodine and the amide group.32,34-36 The addition of PPES hindered the α→γ transition, on the one hand, the destruction of the antiparallel hydrogen bonding of the α-form crystal was hindered by the strong interaction between PPES and MC nylon 6; on the other hand, the anchoring effect from the strong interaction between PPES and MC nylon 6 greater than the twist impact from the coordination of the iodine and the amide group. The higher the PPES content, the greater of the hindering and anchoring effect, thereby making the α→γ form transition more difficult. PPES favored the α-form crystal in PPES/MC nylon 6 composite. Therefore, the results given by the FTIR absorption spectra are consistent with the information provided by X-ray diffraction.
|
Figure 1 XRD curves of MC nylon 6 and its composites at different treatment temperatures: (a) pristine samples; (b) samples quenched in liquid nitrogen from melt; (c) quenched samples annealed at 150 ℃ for 2 h; (d) quenched samples annealed at 210 ℃ for 2 h. |
|
Figure 2 Deconvolution curves of the X-ray diffraction curves of different samples: (a) MC nylon 6; (b) MC nylon 6 quenched in liquid nitrogen from melt; (c) the 0.5% PPES/MC nylon 6 composite annealed at 150 ℃ for 2 h; (d) the 0.5% PPES/MC nylon 6 composite annealed at 210 ℃ for 2 h. |
|
Figure 3 R spectra of the samples untreated and treated with aqueous I2/KI taken as a function of time in the 900-1020 cm-1 region: (a) 0.0%; (b) 0.5%; (c) 2.0%; (d) 4.0%; (e) 6.0%. |
|
Figure 4 Normalization IR spectra of the samples untreated and treated with aqueous I2/KI taken as a function of time in the 900- 1020 cm-1 region: (a) 0.0%; (b) 0.5%; (c) 2.0%; (d) 4.0%; (e) 6.0%. |
|
Figure 5 Deconvolution curves of the IR spectra of MC nylon 6 treated with aqueous I2/KI at different times: (a) 0 min; (b) 5 min; (c) 30 min; (d) 1440 min. |
|
Figure 6 Plots of A976/A928 and A914/A960 vs. the treating time in I2/ KI solution: (a) and (c) overall view; (b) and (d) partially enlarged view. |
|
Table 1 Crystallinity Indices of the α Crystal, the γ Crystal, and the Total Crystal in MC Nylon 6 and Its Composites at Different Treatment Temperatures |
Crystalline structures and transitions of PPES/MC nylon 6 composites were investigated with WXRD and FTIR measurements. The inclusion of PPES to MC nylon 6 did not change the crystalline structure but increased the crystallinity. The presence of PPES improved the orientation of polymer chains in c-axis during crystallization. Annealing increased the CIα, CIγ, and CItotal values of PPES/MC nylon 6 composites, and annealing at 210 ℃ for 2 h improved the orientation of polymer chains in a-axis compared to that of pristine samples. The γ-form crystals of quenched samples could transform into α-form crystals by raising the annealing temperature. And increasing the PPES content promoted the γ→α form transition, which was conducive to crystallizing in the stable a-form crystal. The α-form crystals of the pristine samples could transform to γ-form crystals through treating with aqueous I2/KI. The inclusion of PPES to MC nylon 6 hindered the α→γ transition, which was conducive to crystallizing in the stable α-form crystal. Two consistent observations have come from these studies: PPES favored the α-form crystal in PPES/MC nylon 6 composites. The crystalline transition mechanism involved in this study was the strong interactions between PPES and MC nylon 6 anchored the antiparallel chains hydrogen-bonding of the α-form crystal.
- 1. Uematsu, H.; Kawasaki, T.; Koizumi, K.; Yamaguchi, A.; Sugihara, S.; Yamane, M.; Kawabe, K.; Ozaki, Y.; Tanoue, S. Relationship between Crystalline Structure of Polyamide 6 within Carbon Fibers and Their Mechanical Properties Studied Using Micro-Raman Spectroscopy. Polymer 2021, 223, 123711.
-

- 2. Bartczak, Z.; Argon, A. S.; Cohen, R. E.; Weinberg, M. Toughness Mechanism in Semi-Crystalline Polymer Blends: I. High-Density Polyethylene Toughened with Rubbers. Polymer 1999, 40, 2331-2346.
-
- 3. Zhang, X.; Gohn, A.; Mendis, G.; Buzinkai, J. F.; Weigand, S. J.; Rhoades, A. M. Probing Three Distinct Crystal Polymorphs of Melt-Crystallized Polyamide 6 by an Integrated Fast Scanning Calorimetry Chip System. Macromolecules 2021, 54, 7512-7528.
-
- 4. Lee, J. G.; Kim, Y.; Lee, Y. D.; Yoon, H. J.; Park, J. E.; Jung, K.; Wie, J. J. Crystallinity and Mechanical Properties of Nylon66-Microcrystalline Cellulose Composites. Polym. Korea 2021, 45, 236-245.
-
- 5. Kim, J. S.; Kim, Y. S.; Kim, Y. C. Effect of Carbon Fiber Orientation on the Physical Properties and Crystallization Behavior of Nylon 66/Carbon Filler Composites. Polym. Korea 2019, 43, 547-552.
-
- 6. Olmo, C.; Casas, M.; Martínez, J.; Franco, L.; Puiggalí, J. Crystalline Structures and Structural Transitions of Copolyamides Derived from 1,4-Diaminobutane and Different Ratios of Glutaric and Azelaic Acids. Polymers 2019, 11, 572.
-
- 7. Naga, N.; Sakurai, T.; Hashimoto, T.; Noguchi, K. Crystalline Structure and Phase Transition of Syndiotactic Styrene-Based Copolymers. Polym. Int. 2019, 68, 71-78.
-
- 8. Zheng, Y.; Zhou, J.; Du, F.; Bao, Y.; Shan, G.; Zhang, L.; Dong, H.; Pan, P. Formation of Mesomorphic Polymorph, Thermal-Induced Phase Transition, and Crystalline Structure-Dependent Degradable and Mechanical Properties of Poly(p-dioxanone). Cryst. Growth Des. 2019, 19, 166-176.
-
- 9. Liu, X.; Huang, M.; Zhu, P.; Dong, S.; Dong, X.; Wang, D. Shape Memory Property and Underlying Mechanism by the Phase Separation Control of Poly(ϵ-caprolactone)/Poly(ether-b-amide). Polym. Int. 2018, 67, 1291-1301.
-
- 10. Liu, X.; Wang, Y.; Wang, Z.; Cavallo, D.; Müller, A. J.; Zhu, P.; Zhao, Y.; Dong, X.; Wang, D. The Origin of Memory Effects in the Crystallization of Polyamides: Role of Hydrogen Bonding. Polymer 2020, 188, 122117.
-
- 11. Liu, X. R.; Wang, Y.; Liu, L. Y.; Dong, X.; Wang, D. J. Time and Temperature Dependence of the Structural Evolution for Polyamide 1012. Chin. J. Polym. Sci. 2020, 38, 993-998.
-
- 12. Lotz, B. A Fresh Look at the Structures of Nylons and the Brill Transition. Adv. Fiber Mater. 2021, 3, 203-209.
-
- 13. Jang, E.-J.; Kim, Y.-C. Study on the Crystallization Behavior and Rheological Properties of Nylon 6/Expanded Graphite Composites. Polym. Korea 2023, 47, 164-170.
-
- 14. Puiggalí, J. Aliphatic Polyamides (Nylons): Interplay between Hydrogen Bonds and Crystalline Structures, Polymorphic Transitions and Crystallization. Polymer Crystallization 2021, 4, e10199.
-
- 15. Holmes, D. R.; Bunn, C. W.; Smith, D. J. The Crystal Structure of Polycaproamide: Nylon 6. J. Polym. Sci. 1955, 17, 159-177.
-
- 16. Arimoto, H.; Ishibashi, M.; Hirai, M.; Chatani, Y. Crystal Structure of the γ-form of Nylon 6. J. Polym. Sci. A Gen. Pap. 1965, 3, 317-326.
-
- 17. Zhou, C.; Dong, S.; Zhu, P.; Liu, J.; Wang, D.; Dong, X. Strain-Induced Form Transition and Crystallization Behavior of the Transparent Polyamide. Polymers 2021, 13, 1028.
-
- 18. Ho, J.-C.; Wei, K.-H. Induced γ→α Crystal Transformation in Blends of Polyamide 6 and Liquid Crystalline Copolyester. Macromolecules 2000, 33, 5181-5186.
-
- 19. Brill, R. Über Das Verhalten von Polyamiden Beim Erhitzen. Journal für Praktische Chemie 1942, 161, 49-64.
-
- 20. Yan, T.; Chen, D.; Zhao, B.; Jiang, X.; Wang, L.; Li, Y. Percolation Network Formation in Nylon 6/Montmorillonite Nanocomposites: A Critical Structural Insight and the Impact on Solidification Process and Mechanical Behavior. Polymers 2022, 14, 3672.
-
- 21. Kim, H. Y.; Ryu, M. H.; Kim, D. S.; Song, B.-K.; Jegal, J. Preparation and Characterization of Nylon 6-Morpholinone Random Copolymers Based on ε-Caprolactam and Morpholinone. Polym. Korea 2014, 38, 714-719.
-
- 22. Kim, H. Y.; Goh, J.-S.; Ryu, M. H.; Kim, D. S.; Song, B.-K.; Lee, S. H.; Park, S.-J.; Jegal, J. Preparation and Characterization of Nylon 6,5 Copolymers from ε-Caprolactam and 2-Piperidone. Polym. Korea 2014, 38, 31-37.
-
- 23. Yao, H.; Li, W.; Zeng, Z.; Wang, T.; Zhu, J.; Lin, Z. Non-Isothermal Crystallization Kinetics of Poly(phthalazinone ether sulfone)/MC Nylon 6 In-situ Composites. Iran Polym. J. 2022, 31, 869-882.
-
- 24. Seguela, R. Overview and Critical Survey of Polyamide6 Structural Habits: Misconceptions and Controversies. J. Polym. Sci. 2020, 58, 2971-3003.
-
- 25. Murthy, N. S. Metastable Crystalline Phases in Nylon 6. Polymer 1991, 32, 301-305.
- 26. Kyotani, M.; Mitsuhashi, S. Studies on Crystalline Forms of Nylon 6. II. Crystallization from the Melt. J. Polym. Sci., Part B: Polym. Phys. 1972, 10, 1497-1508.
-
- 27. Fornes, T. D.; Paul, D. R. Crystallization Behavior of Nylon 6 Nanocomposites. Polymer 2003, 44, 3945-3961.
-
- 28. Reynaud, E.; Jouen, T.; Gauthier, C.; Vigier, G.; Varlet, J. Nanofillers in Polymeric Matrix: A Study on Silica Reinforced PA6. Polymer 2001, 42, 8759-8768.
-
- 29. Sefcik, M. D.; Schaefer, J.; Stejskal, E. O.; McKay, R. A. Analysis of the Room-Temperature Molecular Motions of Poly(ethylene terephthalate). Macromolecules 1980, 13, 1132-1137.
-
- 30. Qian, R.; Shen, D.; Li, H. Fourier Transform Infrared Studies of Poly(ethylene terephthalate) Film in the Glass Transition Region. Acta Polym. Sin. 1989, 7, 150-158.
- 31. Kinoshita, Y. The Crystal Structure of Polyheptamethylene Pimelamide (Nylon 77). Die Makromolekulare Chemie 1959, 33, 21-31.
- 32. Arimoto, H. α–γ Transition of Nylon 6. J. Polym. Sci., Part A 1964, 2, 2283-2295.
-
- 33. D’Alò, B.; Coppola, G.; Pallesi, B. Studies of Crystalline Forms of Nylon-6 by X-Ray and i.r. Spectrophotometry. Polymer 1974, 15, 130-132.
-
- 34. Murthy, N. S.; Hatfield, G. R.; Glans, J. H. X-Ray Diffraction and Nuclear Magnetic Resonance Studies of Nylon 6/I2/KI Complexes and Their Transformation into the γ Crystalline Phase. Macromolecules 1990, 23, 1342-1346.
-
- 35. Murthy, N. S.; Khanna, Y. P. Transformations between Polyiodide Structures in a Nylon 6 Matrix. Chem. Mater. 1993, 5, 672-677.
-
- 36. Murthy, N. S. Structure of Iodide Ions in Iodinated Nylon 6 and the Evolution of Hydrogen Bonds between Parallel Chains in Nylon 6. Macromolecules 1987, 20, 309-316.
-
- Polymer(Korea) 폴리머
- Frequency : Bimonthly(odd)
ISSN 0379-153X(Print)
ISSN 2234-8077(Online)
Abbr. Polym. Korea - 2022 Impact Factor : 0.4
- Indexed in SCIE
 This Article
-
2023; 47(4): 417-426
Published online Jul 25, 2023
- 10.7317/pk.2023.47.4.417
- Received on Dec 8, 2022
- Revised on May 14, 2023
- Accepted on May 14, 2023
Services
- Full Text PDF
- Abstract
- ToC
- Acknowledgements
- Conflict of Interest
- Supporting Information
Introduction
Experimental
Results and Discussion
Conclusions
- References
Shared
Correspondence to
- Huimei Yao
-
Ji’an Vocational and Technical College, Ji’an 343000, Jiangxi, China
- E-mail: 13860202695@126.com
- ORCID:
0000-0003-3715-2473
Hyecheon Building(Room 601), #354, Gangnam-Daero, Gangnam-Gu, Seoul 06242, Korea
TEL : 82-2-568-3860, 561-5203, 569-3860 FAX : 82-2553-6938 E-mail: polymer@polymer.or.kr